
To succeed in the financial markets you need to have some kind of system in place.
Trading systems protect the trader from his ‘inner chimp‘ – the limbic side of the brain that relies heavily on emotions and gut instinct. The inner chimp is quick to react and respond to incoming dangers. It often makes snap decisions based on emotion or a feeling.
Thus, the inner chimp is crucial for human survival but is not so useful in trading where more rational, evidence-based decisions are best.

Unfortunately, the chimp part of the brain runs about five times faster than the rational side of the brain, which is why it’s important to try and recognise your inner chimp and pull back when you notice it taking over.
In trading, systems are the best way to combat the inner chimp and make more calculated investment decisions.
However, saying you want to create a trading system is only half of the battle.
Financial markets are increasingly efficient which means the profits from most straightforward trading system rules have been arbitraged out by algorithmic trading.
The conclusion is that traders must think outside the box in order to make a consistent return.
Here are 10 new ideas for your next trading system:
#1. Analyse New Financial Products
The finance industry loves to create a new product which it can then market to the masses as the ‘next big thing’.
Some financial products truly have been game-changers (ETFs?) while others have been disastrous (mortgage-backed securities?) But new financial products give short-term traders a chance to spot inefficiencies, and as a result, opportunities. The proliferation of successful VIX trading strategies is one example of this I think.
Of course, new products are harder to back-test because there is less data available.
But with some common sense and some creativity, new ideas can be born.
For example, what about leveraged ETFs? Is there a way to exploit their unique characteristics? Some leveraged ETFs trade in some very unusual ways. Could you use the movement in a leveraged ETF to trade its underlying, or vice versa?
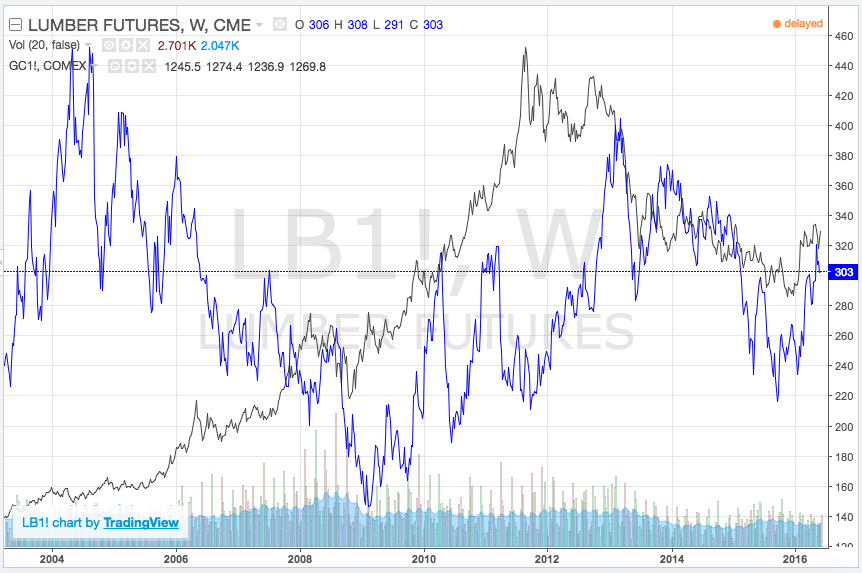
#2. Lumber/ Gold Relationship
Recently, I was reading this academic paper about the relationship between lumber and gold. The paper suggests that the movement of lumber and gold prices can offer clues to the economy and therefore the direction of the stock and bond markets as well. This is because lumber prices are very sensitive to supply and demand in the housing market.
On Quantpedia, a market-timing strategy is presented to take advantage of this correlation.
Personally, this seems like an unlikely combination but it’s worth looking into.
#3. Put Your Indicators On Different Things
Most traders stick to the tried and tested (or should that be tried and failed) method of overlaying technical indicators on their price charts. And who can blame them? After all, that is what most of these indicators were designed to do.
But many technical indicators are much more flexible than that and they can be used in a variety of different ways.
Why not overlay your Bollinger Bands on volume instead of price?
How about using a moving average to smooth a more choppy indicator (like RSI)?
Or import some fundamental data and do the same thing?
#4. Look Into The Future (On Purpose)
When building and testing a new trading system it is important to avoid any future leaks which can lead to unrealistic results. Future leaks occur when a trading system uses data in the future to make decisions in the now.
For example, a trading system that trades on the open but uses a technical indicator that is calculated using the close price. The close price is unknown at the time of the trade so the system is cheating.
However, what about looking into the future on purpose in order to get an insight into what might work. One option is to use the zig zag indicator to identify exact troughs and peaks.
Here’s another idea that I had…
Imagine a stock trading strategy that makes a lot of money 90% of the time but then loses it on large overnight moves.
Further analysis shows that these overnight losses have typically coincided with heavy volume days. And yet further analysis shows that these heavy volume days often coincide with earnings reports.
In other words, if you can avoid the dates when the stock reports earnings you can avoid a large number of losses. If you have this kind of data easily to hand, you can plug it in and tell your system to exit trades whenever an earnings release is coming along.
If you don’t have this data available, could you perhaps approximate earnings events as those days where trading volume is significantly above the average?
By doing so you could tell your trading system to exit the trade the day before a large spike in volume in the assumption that it is an earnings day. The idea is that in real life you would have used an earnings calendar to avoid the earnings report.
Obviously, you have to be very careful here and it won’t always work. But you might find something interesting from the results.
#5. Look At Overnight Moves
Speaking of overnight moves, have you noticed that some stocks seem to gap much more regularly than others?
Maybe you could create a watchlist made up of the stocks that experience the largest overnight volatility and then try your trading ideas out on just those securities?
It’s still true that a good percentage of the overall movement in stocks takes place during the overnight session, a time that the majority of traders pay no attention to. Thus, there are opportunities to take advantage of overnight. I detail such a trading system here.
#6. Look At Non-Farm Payrolls
Take a look at this monthly chart which shows US non-farm payrolls (the employment measure) from 1996 to now. Quite a smooth curve isn’t it?
You can clearly see how payrolls fell during the dotcom bubble and the 2008 crisis. The S&P 500 Index is shown on the bottom.
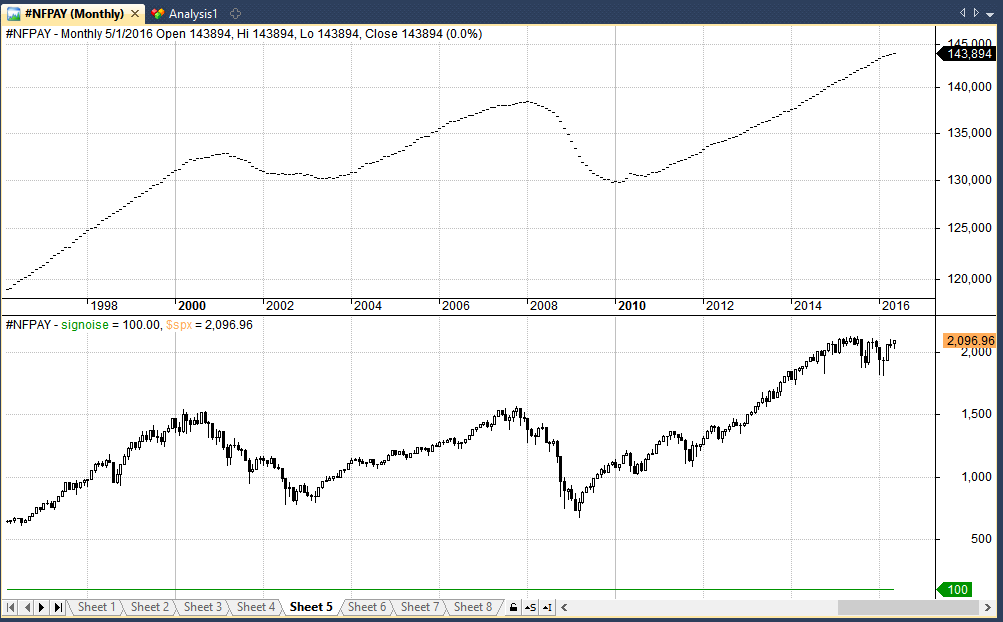
This chart would have been useful for keeping you in the market since the 2009 bottom. Many traders were scared out of the market in 2010 and 2011 but the employment numbers said to stay long.
#7. Optimisation Magic
It’s not wise to be too heavy handed when it comes to trading system optimisation as you don’t want to data-mine and find a curve-fit system. But could you use optimisation to your advantage?
Maybe you could use optimisation in reverse. Instead of optimising your system to find the best parameters use it to find the worst parameters and then get rid of them.
Or consider this approach…
Use optimisation to find a profitable trading pattern that worked over the last 4-8 weeks. Walk it forward and see if it works on the next 4-8 weeks of data. Keep optimising so that you are working with a dynamic, not-static system.
Again, you have to be careful with this one. But there are recurring patterns and they do crop up from time to time and then disappear into thin air.
For example, I found that securities in the midst of long bear markets often see a pattern of buying right near the market close. This is because short sellers don’t want to hold their trades overnight. I’ve made some good money off this in the past but it only happens during heavy sell offs.
#8. Import Data From Different Sources
Big data again.
But if there’s one way to make your trading system unique then it’s going to be by avoiding the usual technical indicators and thinking outside of the box.
I’ve found that a lot of mechanical trading systems can be improved by incorporating fundamental data, news events or other qualitative factors.
How about importing data from Google Trends and using it to see if the most searched for companies make the best investments?
How about importing climate change data from The World Bank and using it to trade corn futures?
How about importing news data from sources like Accern to gauge the sentiment in stocks? This data is often expensive but it can also be harnessed freely with Quantopian.
#9. Price Action Indicators
The trading world is awash with technical indicators so why not create your own based on your own observations. Perhaps you’ve seen a pattern that seems to keep cropping up. Put it into code and test it out.
Perhaps you could come up with your own candlestick pattern like I did with the ‘loose kicker‘?
Code up your price action pattern, put your name on it and call it your own. If it works, sell it for thousands of dollars.
Why not? 😉
#10. Check Correlations. Check Odds
I already spoke of a statistical relationship that was found between lumber and gold prices and the economy.
Chances are that a lot of people know about that one now but there are likely to be other correlations out there that you might be able to identify.
What about the VIX?
The VIX is a great market to look at because it’s mean-reverting. Can you find a correlation that could lead to a profitable edge?
Could you construct your own ‘volatility index’ on a market of your choosing?
What about options prices? Spread betting prices? Bookmakers odds?
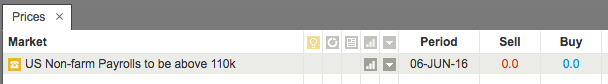
It’s now possible to see the (fixed) odds of certain events such as the outcome of a political event or the daily direction of a particular market. Services like IG Index allow you to actually bet on whether next month’s non-farm payrolls will be over a certain amount.
But how about using this data not to bet but to trade a market that relates to it?
If the odds of a good unemployment number are high, you know what the market is pricing in. A good number and therefore a bullish result. You can use that information to trade the opposite way. That is if you disagree with the odds and think the reward outweighs the risk.
Likewise, if you know the odds of a political event, BREXIT for example, you can use that information to find opportunities, perhaps in the British pound or FTSE 100.
The odds and the market involved should move in correlation but there are times when they diverge and that’s when you can strike.
Overall, There are numerous options and ideas around. Take out a pen and paper and see if you can come up with any!
Joe
I like number eight. I often use goole trends to draw an inverted hypothesis approach and deductive logic of events or stock in the news to prices. Much of the data analysis comes into use when when means reversion and nearest neighbor algorithms line up. For example, water and its effects on global suppliers. I have seen many material, infrastructure providers stock shift with institutional buying is detected in various sectors. Usually the time lag is about 1-2 weeks.
Also, the candlestick for three patterns: morning start, evening start, what I call the let side bloated harami are very interesting patterns I am coding to deterring price range effects.
Hi Bobby
Thanks for the information. I am definitely going to do some more work with data from Google and other sources. How do you detect institutional buying I wonder?
Regarding candlesticks, I didn’t find much use for the morning star or the harami but you might have a different formulation.
Regards
JB
Thinking outside of the box is usually a good thing. It ensures that your trading system will most likely meet your needs. The generic way to do things is easy but isn’t always the most effective method.
Thanks for this post, Joe. New ideas can abound anywhere, and I really like your creative approach. The more questions we ask, the more ideas we generate. The rate at which new data becomes available is dizzying, but there are plenty of ideas we can attempt to exploit based on these data sources.
I have a few thoughts on point #7. Optimisation Magic. Optimization, if you do it, should be done over years of data whenever possible and follow the walk-forward methodology introduced by Bob Pardo, with in-sample and out-of-sample data. I also reserve data, depending on the timeframe, for ‘incubation’ after optimization, to see how the performance may have worked on unseen data.
Finally, I find it useful to compare the results of several values of a parameter that are near the optimized value, to see if the optimized value is the only good value. Example, let’s say my optimization shows that 20 period SMA is the best, but 17, 18, 19, 21, 22, and 23 are terrible. I will probably not want to trade this system as we may have overfitted it to that value. As Perry Kaufman states, “Loose pants fit everyone.”
This is great stuff, keep up the great work!
Thanks Mark.