
The backbone of personal finance is to save more than you spend and invest the proceeds.
The most common advice is to put your money into cheap index funds each month with a simple allocation split.
But what if you want to try something more adventurous?
Index investing may only provide returns of six or seven percent so is there anything else you could try?
How about momentum investing?
In this article I take a simple momentum strategy and show how regular investing into that fund could potentially reap great rewards.
The Momentum Strategy
There is a lot of evidence to back up momentum as a market anomaly and we have created many momentum strategies in the past.
This one is very simple and has been designed for US S&P 1500 stocks:
Buy
- 10-week MA crosses over the 18-week MA
- AND SPX 50-week MA is sloping upwards
Sell
- 10-week MA crosses under 18-week MA
As you can see, we are using simple moving average rules to find stocks that are moving up on a weekly time frame. And we are using a simple market timing filter to avoid buying stocks when the S&P 500 is moving down or in a bear market.
In order to test this properly we will also need some additional backtest rules as below:
Additional Backtest Settings
- Universe: S&P 1500 stocks (including historical constituents)
- Commissions: $0.01 per share
- Liquidity: 10-day turnover must be > 250,000
- Rank: Strongest RSI(14) preferred first
- Starting capital: $25,000
- Portfolio size: 15 max positions
- Position size: Equal weight
- Execution: MA calculations use open price and trades are placed on market close
This is just a typical moving average strategy and we are using a simple RSI rule to rank any duplicate signals. This means if we get more than one signal we will prefer the strongest stock first.
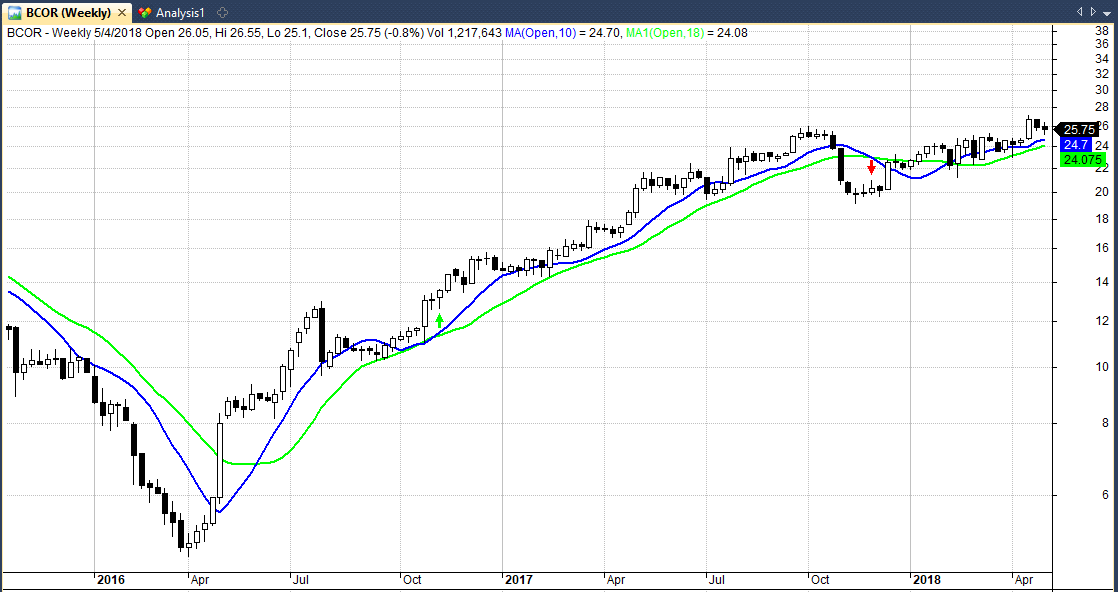
Here’s the kind of trade setup we are looking for in BCOR:
Backtest Results
Backtesting this simple strategy on the S&P 1500 universe between 2000-2018 we get an annualized return of 10.34% with a maximum drawdown of -22.8%.
The win rate is 56.47% and the CAR/MDD ratio is 0.38.
As shown by the following equity graph our capital has increased from a starting pot of $25,000 to a final equity of $146,760:
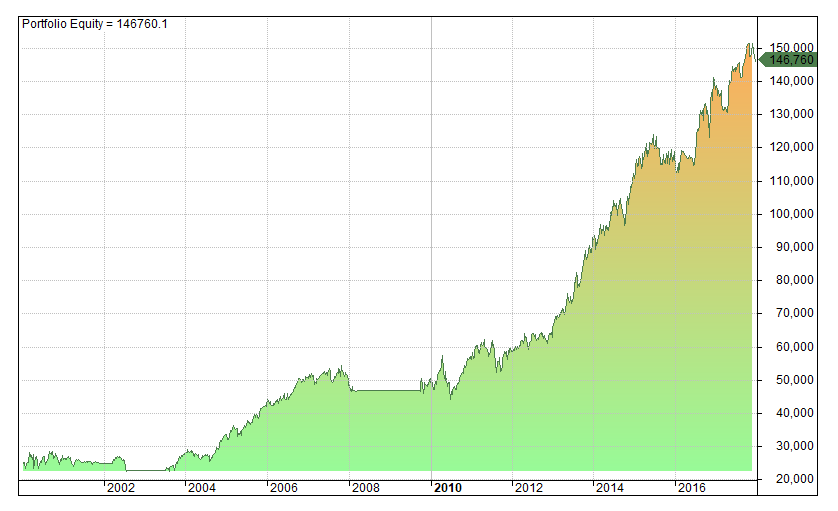
So far we’ve achieved a pretty good result with this simple system.
Buy & Hold Comparison: This compares to a buy and hold return on SPY of 5.39% annualized with a max drawdown of -54% and a final equity of $64,292.
Initiate Cash Injections
Now we have seen the results of our base strategy we can get to the point of this article – what happens if we add regular funds into our trading strategy?
The following equity curve shows what happens if we invest an additional $2,000 every month into our portfolio.
So we start with $25k and every month we get an extra $2,000 that can go into purchasing new stocks according to our rules:
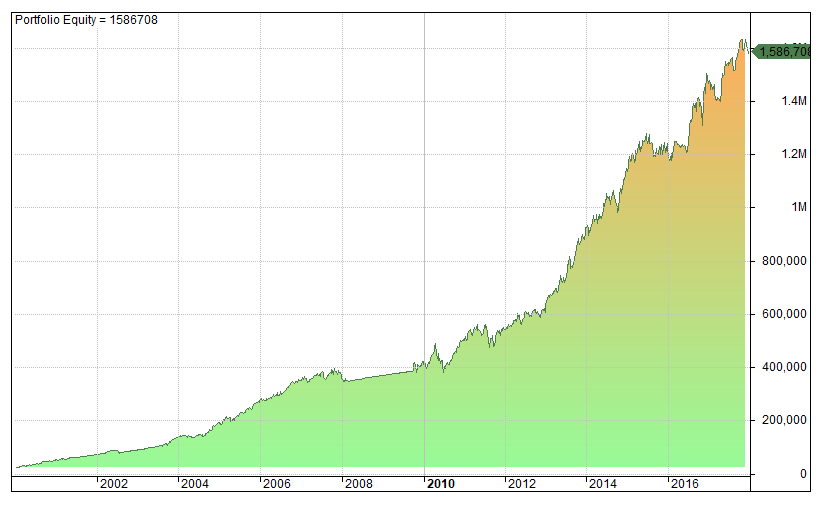
As you can see, the results are quite incredible.
Our final equity is now $1,586,708, 10 times greater than the previous test!
By investing $2,000 into our strategy every month we are growing our portfolio and have more capital to invest in trending stocks.
We have made the same trades and got the same individual trade results, but the more we save and invest into the fund, the higher our equity grows.
Buy & Hold Comparison: Adding $2,000 into a buy and hold portfolio on SPY and re-balancing monthly results in an end capital of $696,171.
That’s not as good as our momentum strategy but it’s still pretty good if all you want is an easy way to save and invest.
Some notes about the test
A couple of points to mention about the test above.
- Cash injections are made at the beginning of each month and then made available for new stock purchases.
- You can see that equity rises in a uniform straight line in periods such as 2008. This is because our trading strategy is flat (SPX is trending lower so we do not enter new trade signals) but we are still contributing $2,000 in cash to the portfolio each month.
- If we assume uninvested cash is put into an interest-bearing account of 2%, the final equity improves to $1,630,145.
- The amount and frequency of contributions can easily be adjusted to provide more interesting results. I have provided some free code here where you can easily adjust these parameters.
Final Thoughts & Assumptions
As you can see, by regularly investing into our momentum strategy we have dramatically increased our overall net worth.
Without monthly contributions we finished with $146,760 but with monthly investments we have made it to over $1.5 million in 18 years.
The rewards are enticing and this if definitely an approach to think about.
However, our results do still rest on one assumption — that this trading strategy continues to work in the future.
If momentum stops working or this strategy is not suitably robust, then you may not get results as good as these and you may have been better off with buy and hold after all.
On the flip side, momentum strategies have been working for hundreds of years so there’s a good chance they will continue to work going forward.
I wouldn’t mind betting that this approach will beat buy and hold in the long run but there’s always the risk that it won’t.
Even so, the purpose of this article is to show that regular investment into your chosen strategy can reap big rewards. The results speak for themselves.
Simulations in this article produced with Amibroker using data from Norgate. Data is adjusted for splits, dividends and capital actions and includes historical/delisted members. Commissions of $0.01 per share included in test results.
Rank: Strongest RSI(14) preferred first – I have a question for you here. Is this a weekly 14 RSI or a daily 14 RSI? Thank you, Ric
Good question. It is weekly RSI.
Just to clarify, by “strongest” RSI do you mean highest value or lowest?
Highest.
New here – and great input, love your approach to markets in general.
I’ve got two questions on this:
With 15 positions max, does it mean there is no portfolio shifting until there is a sell signal in one of them?
And would your gut feeling be that results improve by adding a hedging strategy on S&P 500 (e.g. reverse ETF) than selling stocks? Taxation can always be a factor in these models I guess
Hi thanks for your message. Yes that’s right positions are held until a sell signal comes along. 15 positions isn’t many in this regard.
I have seen some pretty good hedging models yes so that is an option. Personally, I would just stick to long only and ride out the drawdowns but that is personal preference.