The 200 day moving average is an extremely popular indicator among traders and trend followers. When a stock is above the 200 day MA, it’s said to be in an uptrend and when it’s below, it’s said to be in a downtrend.
In this article I look at a strategy that buys upward trending stocks as they pull back towards the 200 day moving average line. I test the signal on S&P 500 stocks back to 2000 but I find no real edge to this signal on it’s own.
The 200 Day Moving Average
The 200 day moving average was popularized by Paul Tudor Jones who used it to successfully avoid the stock market crash of 1987. It’s said that Jones exited most of his long trades in the run up to the crash as they dipped below the 200 day MA. This saved Jones from huge losses in one of the biggest stock market crashes in history.
Ever since that time, the 200 day moving average has been considered a quick and easy way to tell whether a market is going up or going down.
The 200 Day Moving Average Pullback
Another popular strategy among traders is to use the 200 day moving average as an entry point into an already existing upward trend. In this way, the 200 day acts as an important area of support for traders looking to rejoin the upward move.
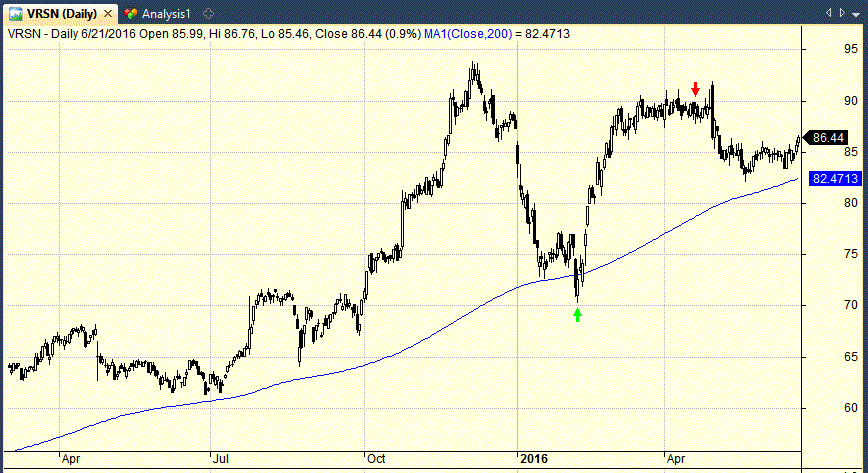
The following chart provides a clear example. As you can see, VRSN is in an upward trend. It pulls back towards the 200 day MA in Feb 2016. The 200 day MA acts as an area of support and the stock bounces off this level and resumes its upward march.
The benefits of using the 200 day moving average as an entry is that it gives traders the chance to re-enter a trend that they may have missed. It also means that the trader is able to rejoin the trend without having to buy at new highs, a technique that can often lead to sharp whipsaws.
However, not every stock that pulls back to the 200 day moving average is going to carry on in an upward trend and some will shoot through the indicator and carry on heading south. In this event, the stock will fall below the entry price and the trade will be a loser.
Does It Work?
This type of trading signal has become quite popular with some trend traders. In fact, I have seen many well known traders promote such simple strategies. In the rest of this article we will see how effective the signal has actually been using historical data to support our findings.
Testing The 200 Day Moving Average Pullback (Or Bounce)
To test the effectiveness of the 200 day moving average pullback (or bounce) signal I created some code in Amibroker and back-tested the signal on historical data on S&P 500 stocks between 1/2000 and 1/2017 with various holding periods.
The signal looks for stocks that have been above their 200 day moving average for over 100 consecutive days which then drop back towards the 200 day moving average and trade through the indicator line. Once the stock has traded through the 200 day MA we go long on the next open and sell after a period of time.
The previous chart that was shown above is a good example of the trade we are looking for. Note that the high of the day must be higher than the 200 day MA and the low of the day must be lower than the 200 day MA to get our signal. We need price to trade through the line to get the signal.
Amibroker Code
The Amibroker code for this price signal is shown below:
ConBarsOver = BarsSince( C <= MA(C,200));

BarsOver = ConBarsOver > 100;

TradeThrough = H>MA(C,200) AND L<MA(C,200);

MA200Pullback = BarsOver AND TradeThrough;

Buy = MA200Pullback;
200 Day Moving Average Pullback Results
I back-tested this signal on historical data for S&P 500 stocks between 1/2000 and 1/2017 with varying holding periods.
(The data includes delisted tickers and adjustments for corporate actions, splits and dividends. I also avoided any stocks with an average turnover of less than $250,000.)
Results are now shown below:
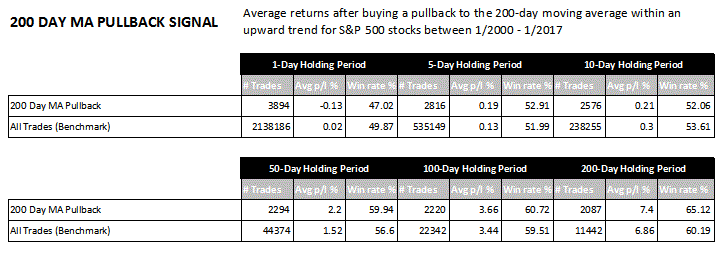
As you can see from the table, there were 3894 occurrences where a stock pulled back from its upward trend and then traded through its 200 day moving average in 17 years of price data.
You can see that the average profit per trade from buying this signal on the next open was -0.13% with a win rate of 47% – based on a holding period of 1 day.
This was no better than our benchmark result. The average profit for a 1-day holding period across all S&P 500 stocks throughout the data period was 0.02%. Our signal did worse than this so obviously there is no edge here.
The average profit and average win rate does improve with longer holding periods.
With a 5-day holding period we saw an average profit of 0.19% and with a 50-day holding period, we saw an average profit of 2.2% per trade.
However, the performance in each case is only marginally better than our benchmark. This continues to suggest that the signal does not provide much of an edge as it stands.
What Does This Mean?
In other words, when you buy a trending stock that has pulled back to its 200 day moving average you are by no means guaranteed a profitable trade.
If you plan to hold for 10 days, you only have a 53% chance of it being a winner. What’s more, the average profit is small and this is without even taking into account commissions.
You could hold your trade for longer and you would likely capture a larger gain. But if you do that you are simply moving into buy and hold territory.
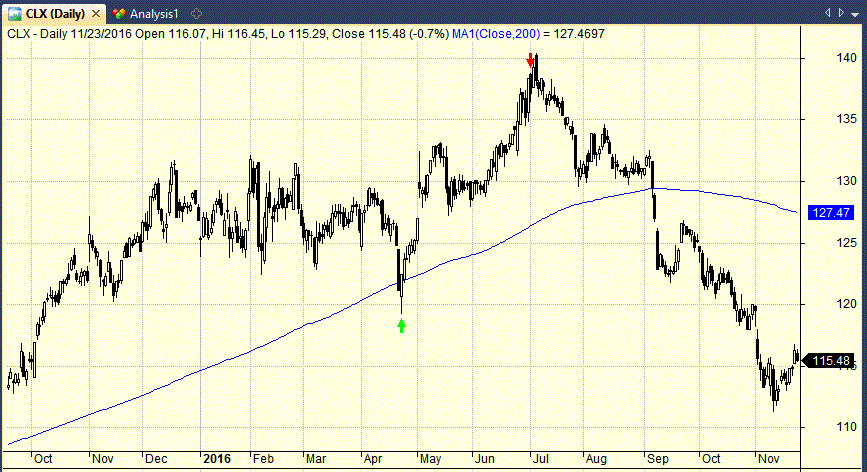
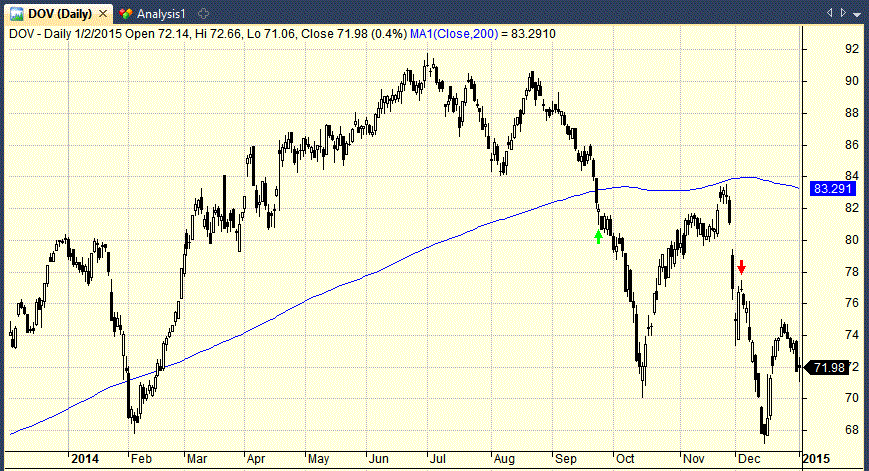
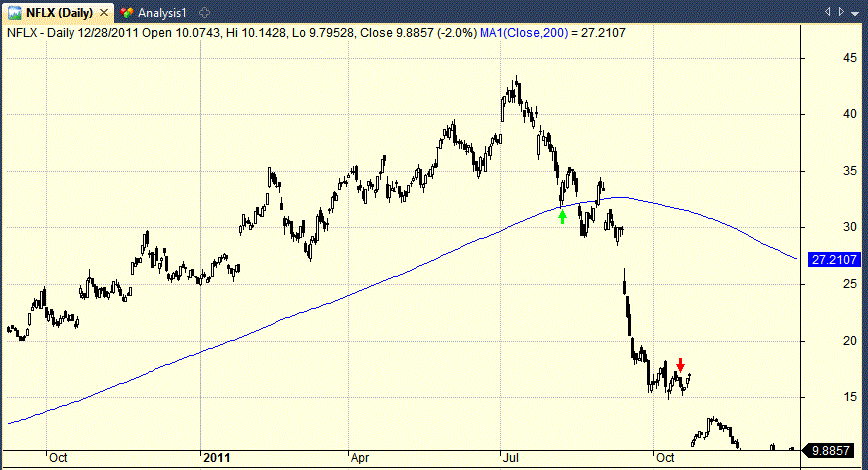
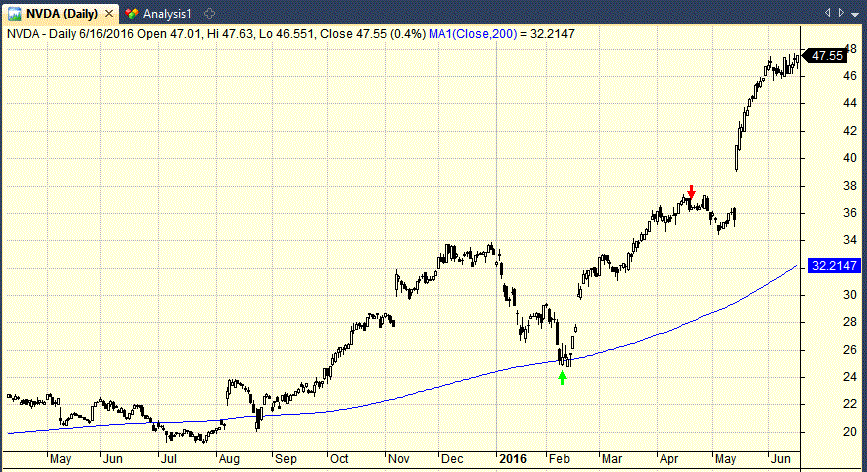
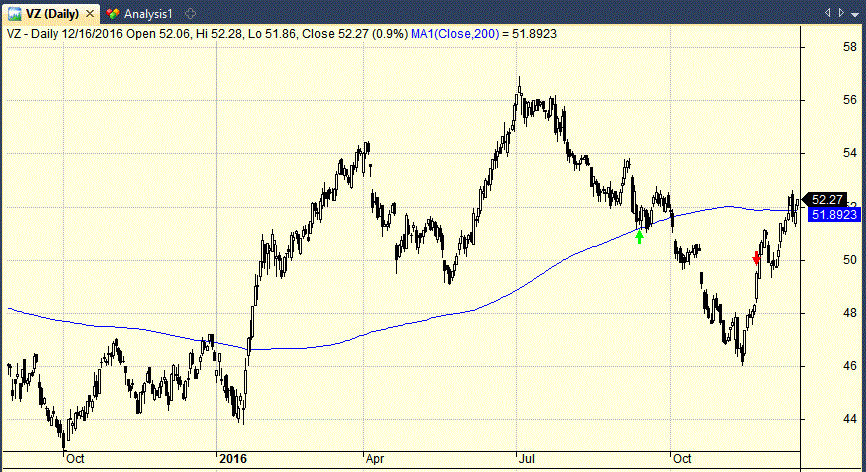
The fact is that the pullback pattern works some of the time but not all of the time and it is by no means a profitable chart pattern on it’s own. The charts below show some examples of various winners and losers:

Reverse The Signal
Whenever back-testing a particular trading signal it is always a good idea to try out the trading idea in reverse. Many times I have found that the conventional wisdom concerning a technical indicator or pattern is proven wrong by the data and it is actually better to do the opposite than what the textbooks recommend.
(I found this in my analysis of the inverted hammer candlestick pattern for example which was shown to be a bullish and not a bearish indicator).
The next test, therefore, shows the results for the opposite signal. In other words, this signal looks for stocks that have been below their 200 day moving average for more than 100 consecutive days which then cross back over their 200-day moving average.
Following is a clear example in NTAP shown with a holding period of 50 days. The stock is trading under the 200 MA for a long time before it breaks up through the indicator line:
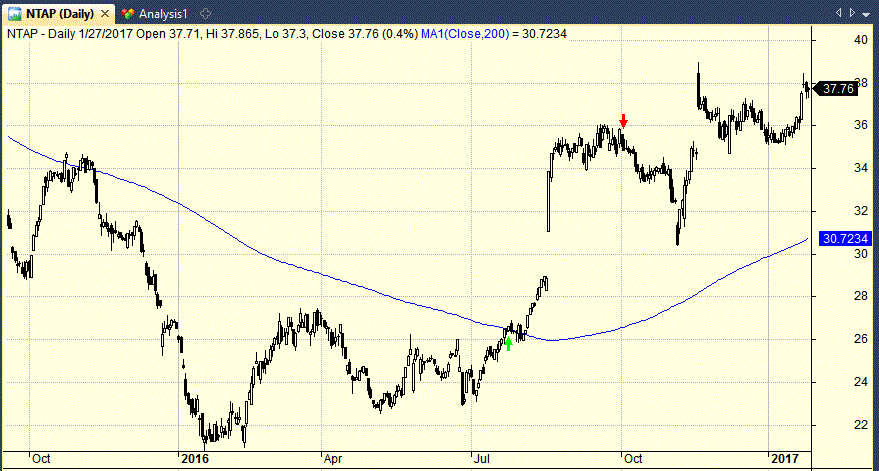
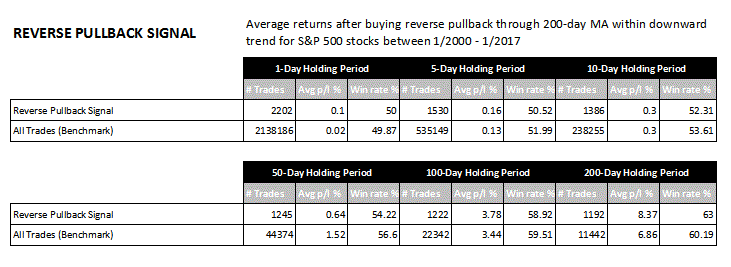
As you will see from the following table of results, this pattern also performs poorly. For instance, we got an average profit of only 0.64% and a win rate of 54.22% with a 50-day holding period. This is a worse result than we could expect from random, which is indicated by the benchmark:
Amibroker Code
The Amibroker code for this signal is shown below:
ConBarsUnder = BarsSince( C >= MA(C,200));

BarsUnder = ConBarsUnder > 100;

ReversePullback = BarsUnder AND TradeThrough;

Buy = ReversePullback;
Improving The Signals
The difficulty with testing any technical or price action trading signal is developing an objective and realistic set of rules with which to back-test the data.
Obviously, a real trader is unlikely to take any signal based on one indicator on its own. Usually, when a trader looks at a chart they take into account all sorts of different information.
Thus, it seems reasonable to try and improve on our original signal with additional rules. This has the advantage of being a more realistic trade signal but comes with the disadvantage of fewer trades and the risk of curve fitting if we are to test too many variables.
Market Timing Filter
One simple way that we might improve the signals discussed is to introduce some type of market timing filter. As we know, stocks go down together during a bear market so it makes sense to try and avoid these periods if we can.
The following tests therefore contain the same rules as before but are limited only to periods when the broader market (S&P 500 index) is also above its 200 MA.
Trading The Pullback In Bull Markets Only
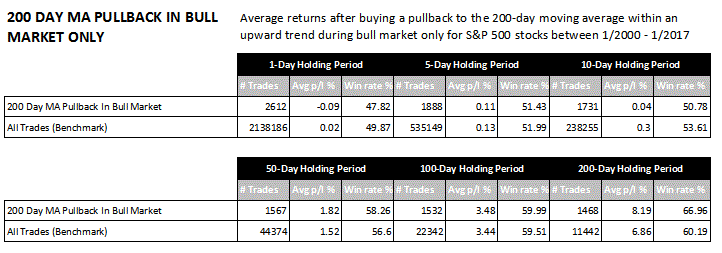
The next table shows results for the pullback signal during bull market periods only. Where a bull market is defined as the S&P 500 Index being above its 200 day MA. The advantage of this signal is that we are going to avoid buying stocks when the overall market is heading down.
As you can see from these results, they are not sharply different from what we got when the market timing filter was not applied. So there is no real benefit to buying the 200 day MA during bull markets as opposed to bear markets.
Trading The Reverse Pullback In Bull Markets Only
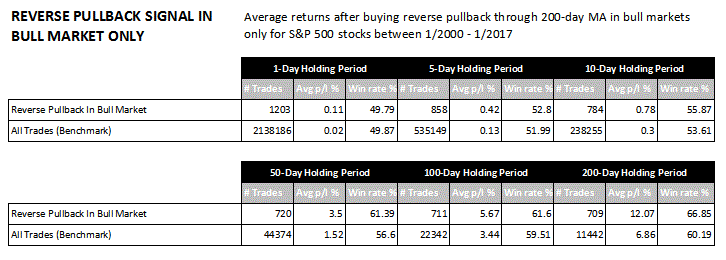
The next table shows results for the reverse pullback signal during bull market periods only. This signal requires price to have traded under the 200 day MA for over 100 days before trading up through the indicator line.
As you can see from the table, these are the best results yet. We saw an average profit per trade of 0.78% over 10 days, 3.5% over 50 days, 5.67% over 100 days and 12.07% over 200 days. The win rate and average profit was higher than the benchmark in nearly every test – although we also saw fewer trades.
This result is a lot better than our previous tests and shows that the conventional wisdom regarding the 200 day moving average could be wrong. However, this is still probably not a pattern that is worth trading unless we can improve on these numbers further.
Putting It All Together
It is also possible to put together a portfolio strategy based on this trading signal. The following equity curve shows a 10 position portfolio back-tested on the S&P 500 universe. This portfolio uses the reverse pullback signal like before and only trades during bull market periods. This time it exits by 25% trailing stop only.
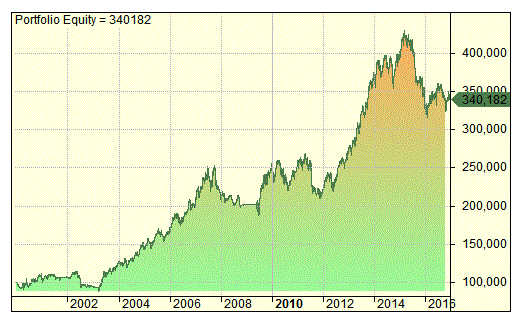
As you can see, the equity curve is not too bad here and we have recorded an annualised return of 7.47% with a maximum drawdown of -26.29%. This gives us a CAR/MDD of 0.28. It could probably be improved.
Conclusions
I have heard it said before that the market doesn’t care for moving averages, it reacts to fundamentals and investor behavior only.
I think that this statement is somewhat true and is backed up by some of the results on this page which are overall, less than exciting. Generally, the efficient nature of the stock market means that finding an edge with simple moving averages is hard.
When experts claim to have picked winners using such simple strategies it seems to defy the odds and suggests that there must be more to it. Moreover, we have found that the conventional wisdom regarding these patterns is often the opposite of what actually works. Here, the pullback to the 200 MA from an upward trend does not work as well as trading through the MA from a downward trend.
But simple moving averages can still be useful for identifying trends and also for deciding whether to stay in or out of the market. I have created systems in the past which use moving averages to trade trends and they have worked in back-tests and in live forward trading.
The price signals we investigated today were not particularly impressive and they don’t show any short-term edge. But they still might be useful on longer term time frames when combined with other signals.
…If you have any price signals you like to look at please mention them in the comments.
Simulations made with Amibroker using data from Norgate.

The ma200 is useful but as a guide only. Anything can happen above the 200 and invariably does. Sometimes using a quicker ema of 150, 100 or 75 for confirmation in line with the exit objective can work. I’ve used the SP500 breadth indicator by averaging the number of stocks above ma200 over a period of time. If the numbers are going down, stay out.
Yes, good call about using a breadth indicator, I will do an article on that some day.
Hello JB,
so have you done yet this breadth indicator backtest ?
Chhers,
Tonio.
Which one?
Thanks for sharing this analysis Joe. It’s interesting to get the hard data on some of these common indicators. I also agree with Helena’s comment that the 200-day MA may serve as a useful guide or filter to avoid bear markets, even if it doesn’t provide super profitable trading signals.
Yes agree, that is how I use it too – as a filter.
Hello,
Have you tried the same backtest but with a 50 SMA instead and/or with a broader market (say Russell 3000)? If so, can you please share the results?
Yes I have. The results are no better and not worth posting.