
There has been a lot of discussion recently regarding the impact of stock splits.
With two of the biggest names (Apple and Tesla) announcing splits you might be wondering about their significance. Especially since both stocks have already run up a huge amount since March.
In theory, a stock split does nothing to change the underlying value of a company so it shouldn’t have any real impact.
But the truth is, stock splits and reverse splits do provide some insights.
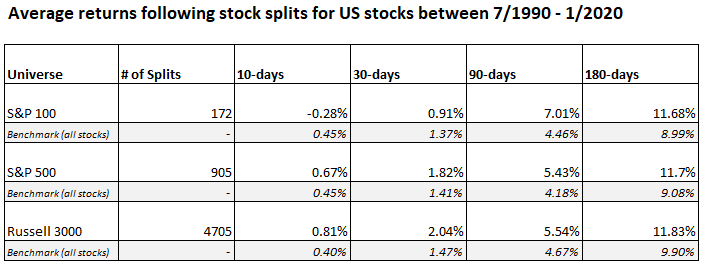
For example, the following table shows that stocks undergoing splits have outperformed their peers since 1990:
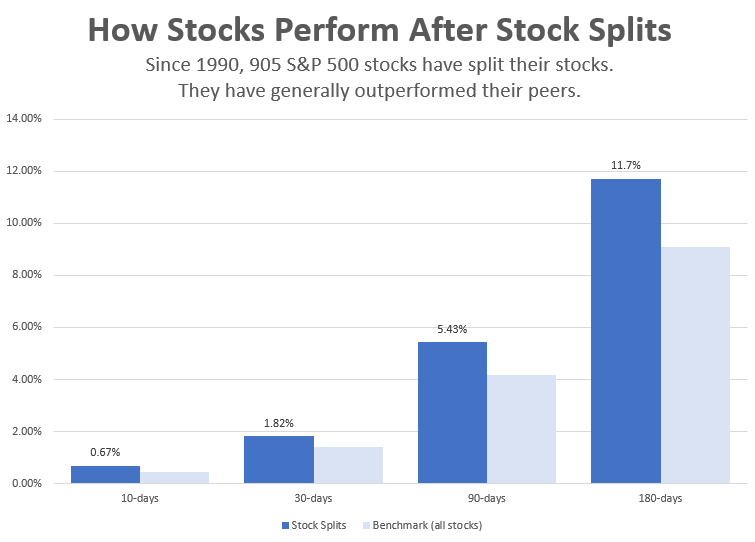
The chart below shows it more clearly:
Summary
Stocks that have undergone splits have generally outperformed their peers over the medium to long term.
For example, in the S&P 100, I counted 172 stock splits, and the average return after 180 days was 11.68%. Meanwhile, the average return for all stocks was only 8.99%. That’s an outperformance of almost 3%.
Similarly, there were 905 splits in the S&P 500 and the average return over 180 days was 11.7% for those stocks compared to 9.08% for all stocks.
It was a similar story for stocks from the Russell 3000 universe where stock split stocks recorded a 11.83% average return compared to 9.90% for all stocks.
Reverse Stock Splits
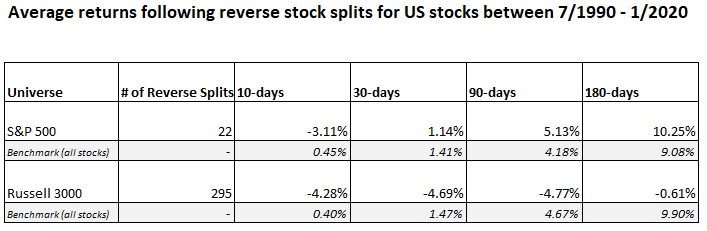
We can do a similar analysis for reverse stock splits. As you can see in the table below, average returns are generally poor after a reverse split:
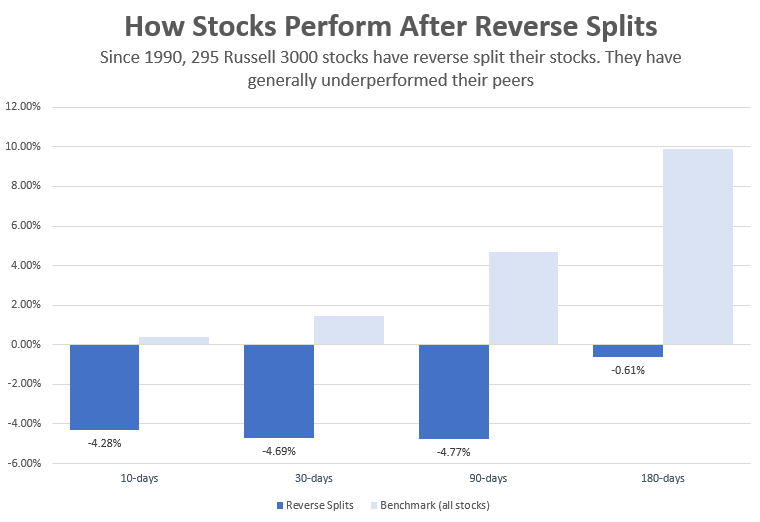
The next chart shows it more clearly:
Summary
The analysis on reverse stock splits differs substantially to ordinary splits.
In the Russell 3000, I counted 295 reverse splits going back to 1990 and there is a clear under performance.
For example, stocks undergoing reverse splits saw a 90-day average loss of -4.77%. Meanwhile, the average return for all stocks was positive 4.67%.
Stocks undergoing reverse splits were still in negative territory after 180 days.
I counted only 22 reverse splits in the S&P 500 which is too small of a sample for any meaningful comparison in that universe.
Stock Splits At New Highs
Finally, a reader commented that it might be interesting to see the performance of stock splits on stocks that are at new highs.
As you can see from the table below, there were 589 stock splits between 1990 to 2020 while a stock was at a 252-day / 52-week high.
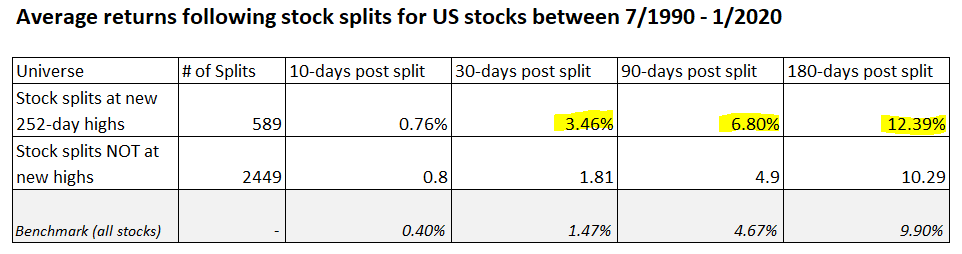
The average return for stock splits at new 252-day highs is greater over 30, 90 and 180 days post split. Therefore it seems that stocks that split at new highs are even better performers than those not at new highs.
Conclusions
In theory, a stock split should have no impact on the value of a company and should provide no edge over other stocks in the marketplace.
However, you can see from our analysis that stock split stocks generally outperform.
That could be because splits improve liquidity. Or it could be that a split indicates a stronger company with a better chance of continuing that strong performance.
In other words, it is closely correlated with the momentum factor. In fact, you can see that performance even improves for stock splits that take place at new 52-week highs.
Conversely, you can see that reverse stock splits are a negative indicator.
This also makes sense since a reverse split often signals a mediocre company that is struggling to make a profit or attract investors.
Often, a reverse split is undertaken because a stock has fallen in value and needs to trade above a certain price level to fulfill exchange listing requirements.
Shorting such stocks is not straightforward, however, due to borrowing costs and can be risky on an individual trade level.
What Does This Mean For Apple And Tesla?
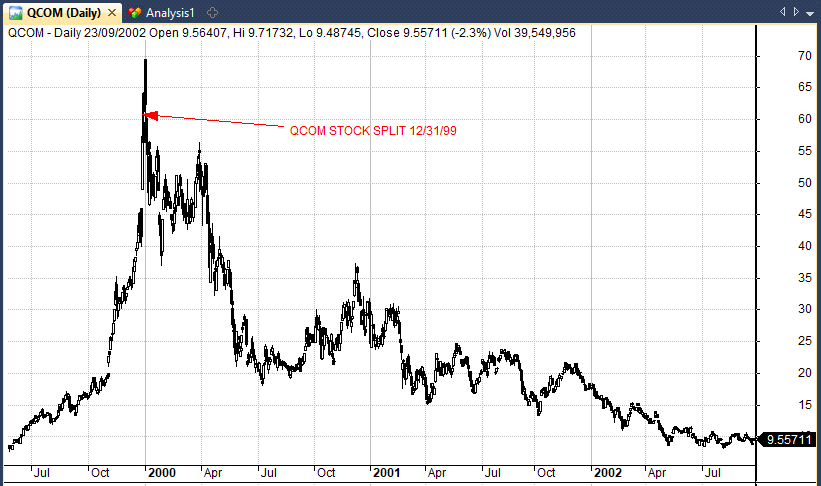
Of course, this analysis does not mean that upcoming stock splits will necessarily be bullish events for Apple or Tesla. There are always going to be some stocks that buck the trend.
In fact, I thought it relevant to sign off with the example of Qualcomm which underwent a 4:1 stock split on the 31st December 1999, right at the peak of the Dotcom bubble:
Notes
Analysis in this article produced in Amibroker with data from Norgate. Data includes historical constituents, delisted stocks, dividends and ignores transaction costs. Some splits/ reverse splits may have been missed. We chose to focus on splits with a ratio no less than 3:2 and ignored less meaningful splits.
Good, you saved me doing it myself. Note AAPL will drop to 1/5 weight in DJIA which is very significant for things like NDX/DJIA rotation research.
Good point thanks.