

20 years ago we were in the middle of the dotcom bubble. This was not a great time to invest since many stocks were at their peak earnings. Many never recovered and a few went bankrupt.
However, some companies grew out of the rubble and posted mouth-watering returns. I decided to look at which stocks have performed the best over the last 20 years and share that analysis below.
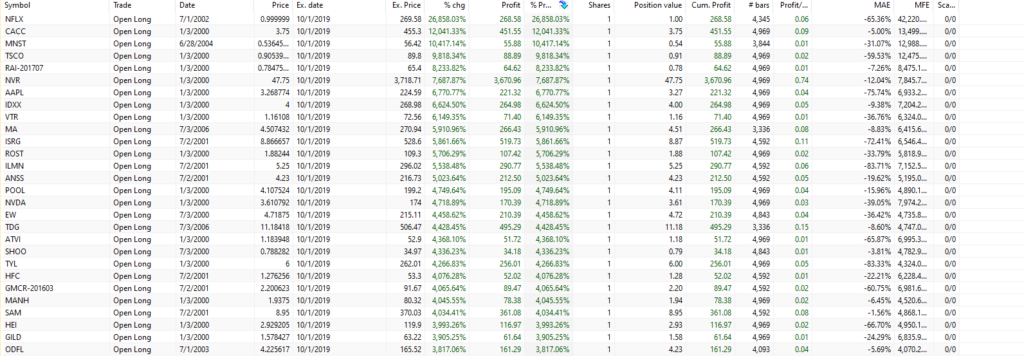
The only criteria for this list is that the stock must have a price over $1 and belong to the Russell 3000 universe at the time of purchase. I measured performance from the year 2000 onward.
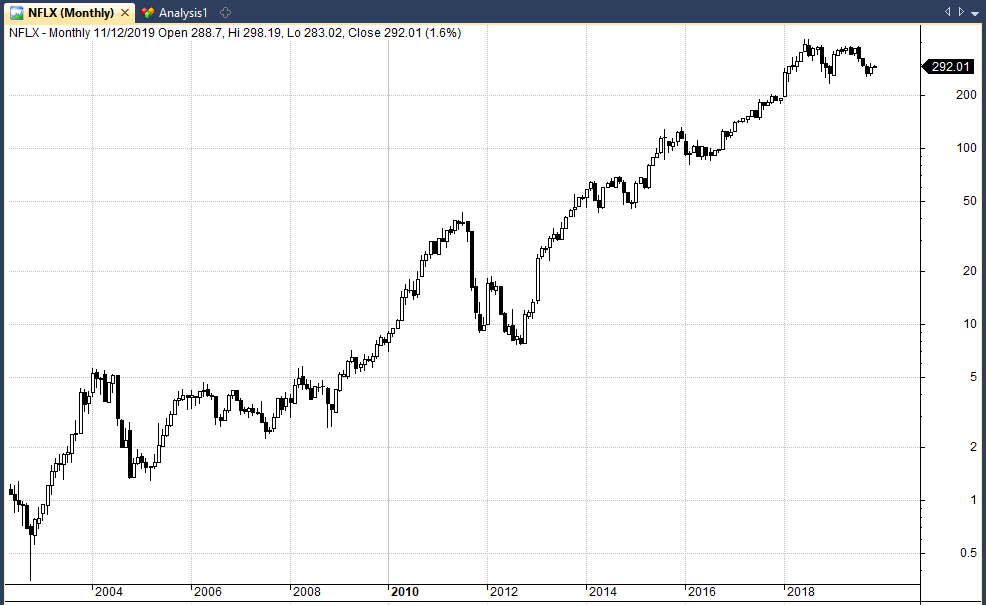
1. Netflix (NFLX) +26,858.03%
The number one stock on our list is Netflix with an astonishing return of 26,858.03% since July 2002.
Some interesting facts about the company:
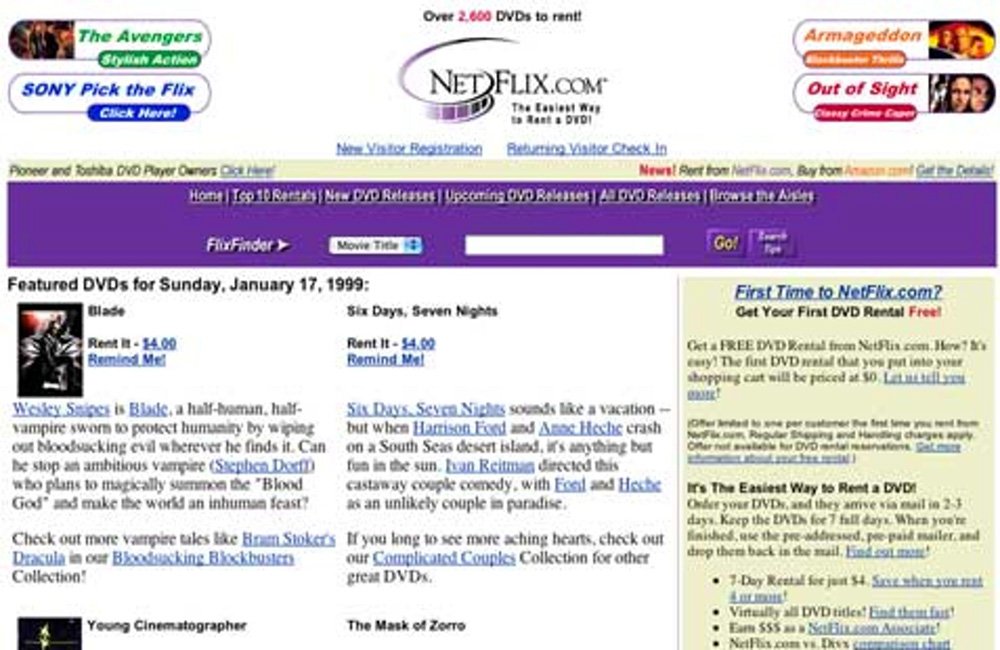
- Netflix was founded in Scotts Valley by Marc Randolph and Reed Hastings in August 1997.
- In April 1998 Netflix launched its website with 925 titles available to rent.
- July 1999 Netfix raised $30 million in venture capital and launched a monthly subscription in September.
- In 2000 Netflix offered itself to Blockbuster for $50 million but Blockbuster declined.
- In May 2002, Netflix filed for IPO selling 5.5 million shares at $15 per share.
- In April 2003, Netflix reported 1 million paying subscribers
- January 2007, Netflix launched streaming video.
- November 2011, Netflix shares drop 78% as 800,000 subscribers leave and operating costs hurt profits.
- In 2017, a study showed that the number of Netflix subscribers now equals that of all the US cable subscribers combined.
Netflix price chart:
(all price charts shown are log charts for better visibility)
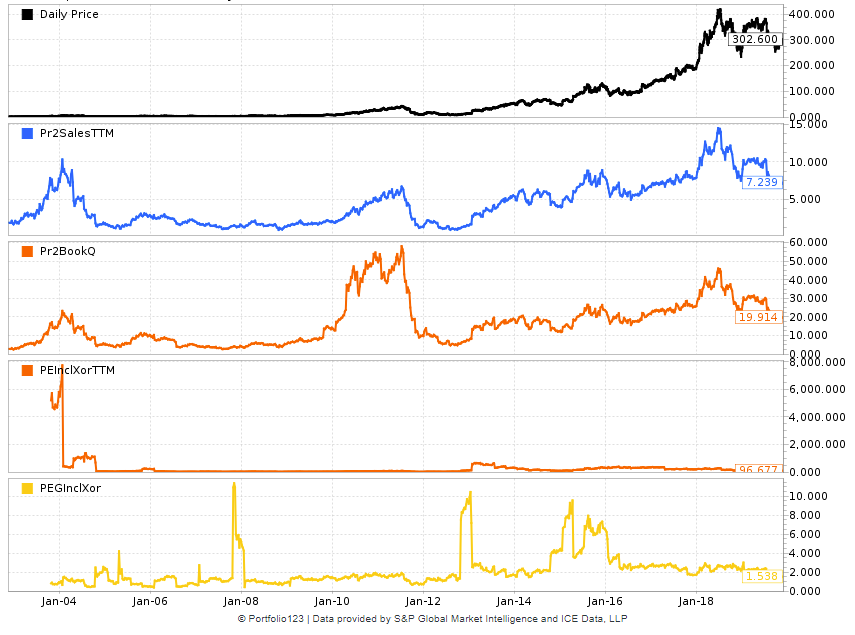
Fundamental chart:
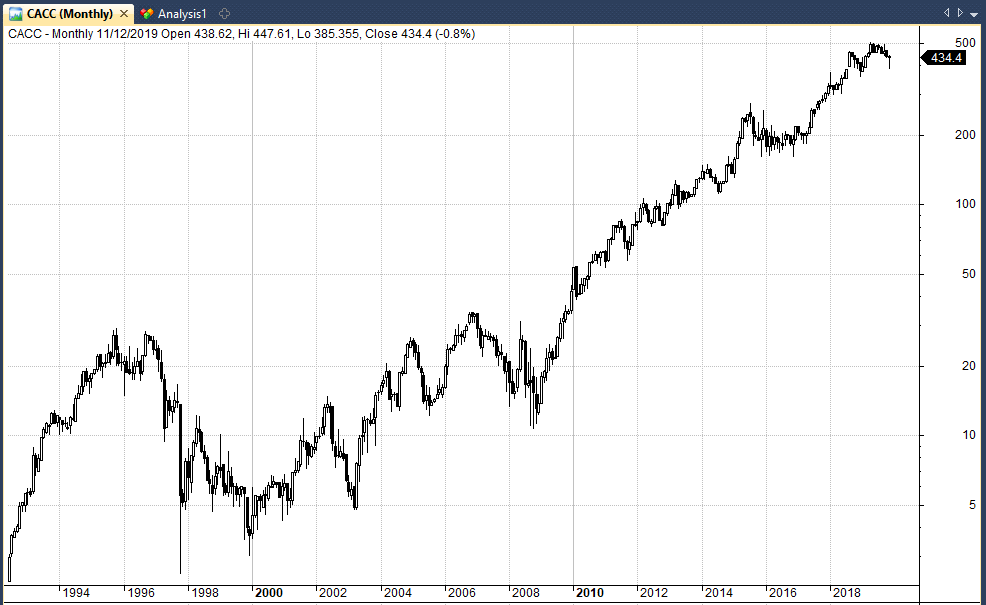
2. Credit Acceptance Corp. (CACC) +12,041.33%
Number two spot goes to Credit Acceptance Corp, an auto finance company that began in 1970 as a car dealership. CACC listed in 1992 and now does over $1 billion in annual revenues.
The company offers auto dealers financing programs to help them sell vehicles to consumers, regardless of their credit history. Part of their success stems from the fact enrolled dealers share in the cash flows from the contract, which creates an alignment of interests.
Dealers have an incentive to sell reliable vehicles that last the term of the contracts, as they benefit from those who successfully repay their contracts.
Price chart:
Fundamental chart:
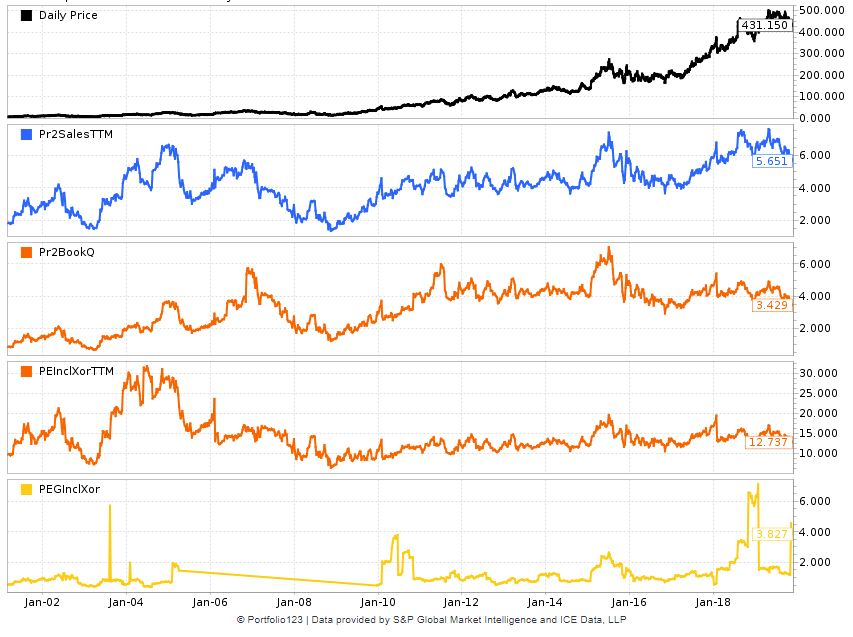
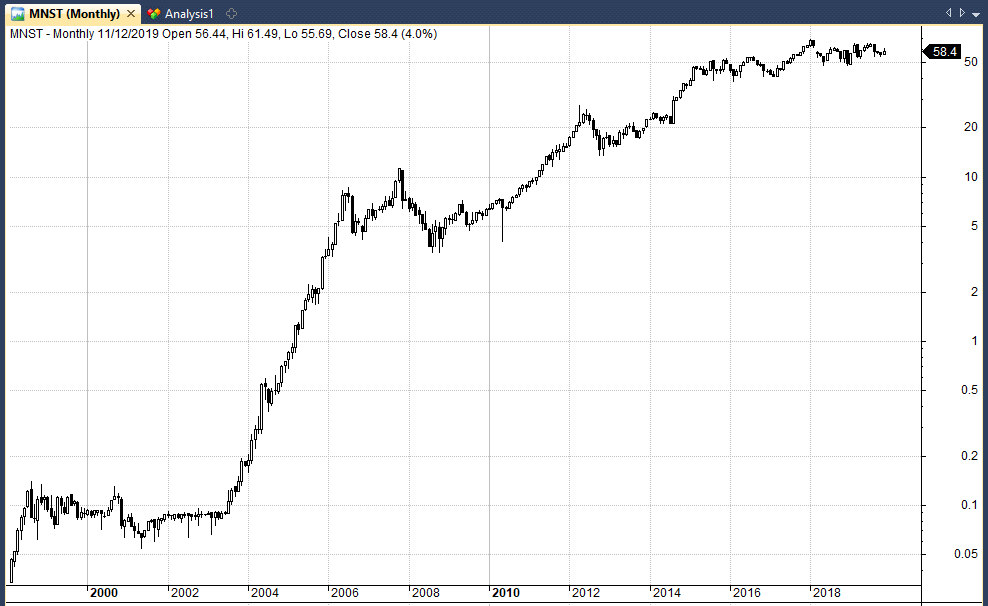
3. Monster Beverage Corp. (MNST) +10,417.14%
Monster Beverage Corp began life as Hansen’s Juices back in 1935 and now employs 3000 staff.
The firm markets and sells energy drinks such as Monster Energy, Monster Energy Extra Strength, NOS, Full Throttle, Burn, coffee drinks, soft drinks and energy shakes.
The company started a marketing strategy of endorsing sports athletes in 2005 and began ramping up its selection of drinks leading to massive growth.
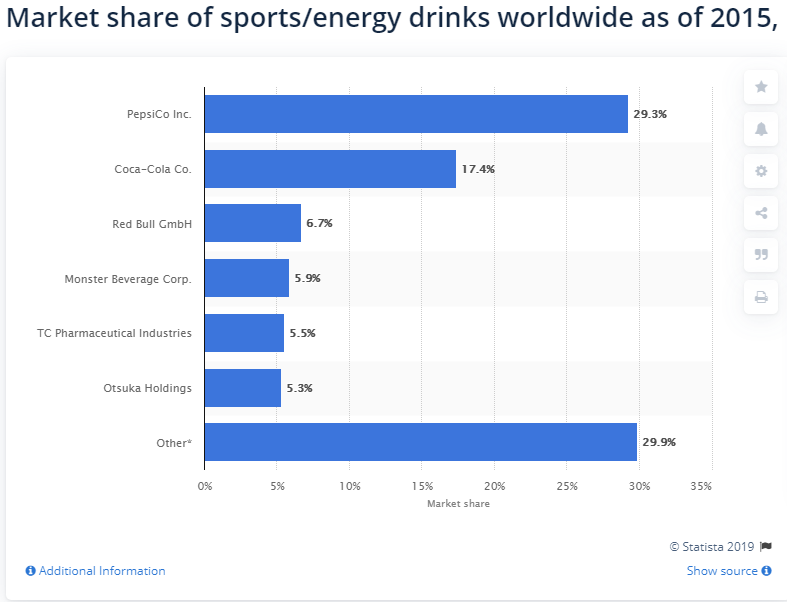
According to Statista, Monster Beverage holds around 5.9% of the global energy/sports drinks market.
Price chart:
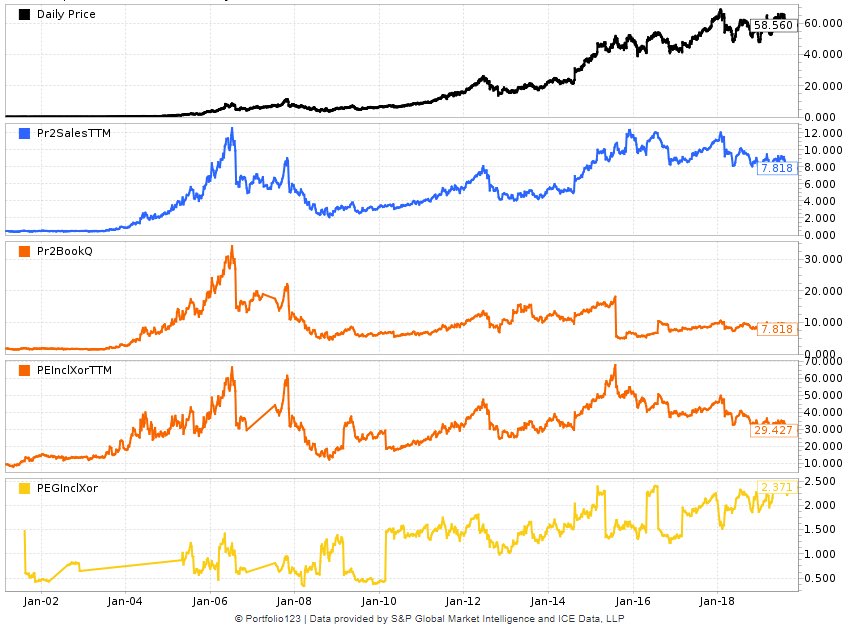
Fundamental chart:
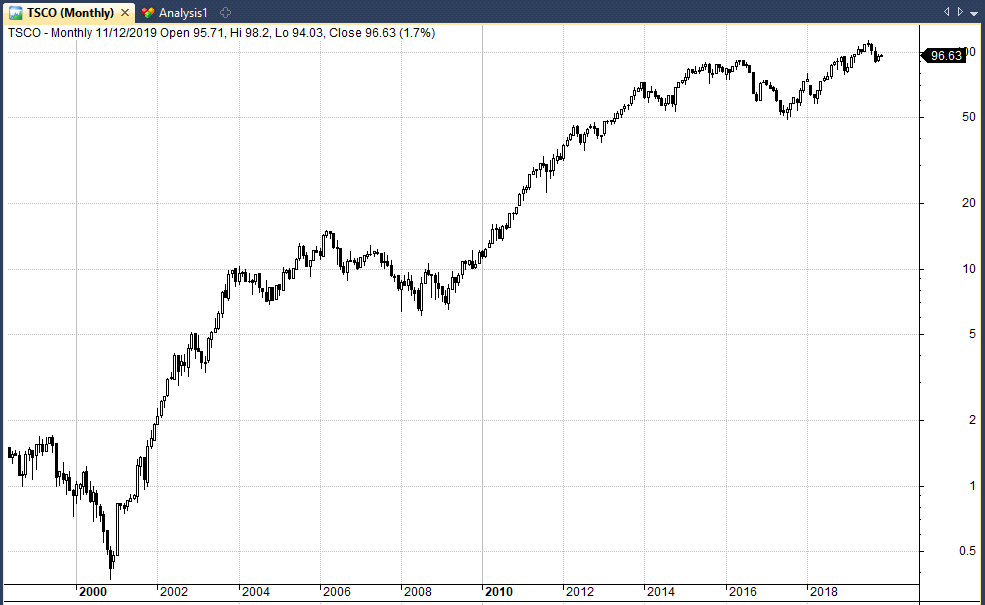
4. Tractor Supply Company (TSCO) +9,818.34%
Proving that not all winning stocks are hot-shot IPOs the Tractor Supply Company was founded in 1938 as a mail order company for Tractor parts.
The company has since expanded into home improvement, agriculture, lawn maintenance, livestock and pet care and has over 1800 stores.
Price chart:
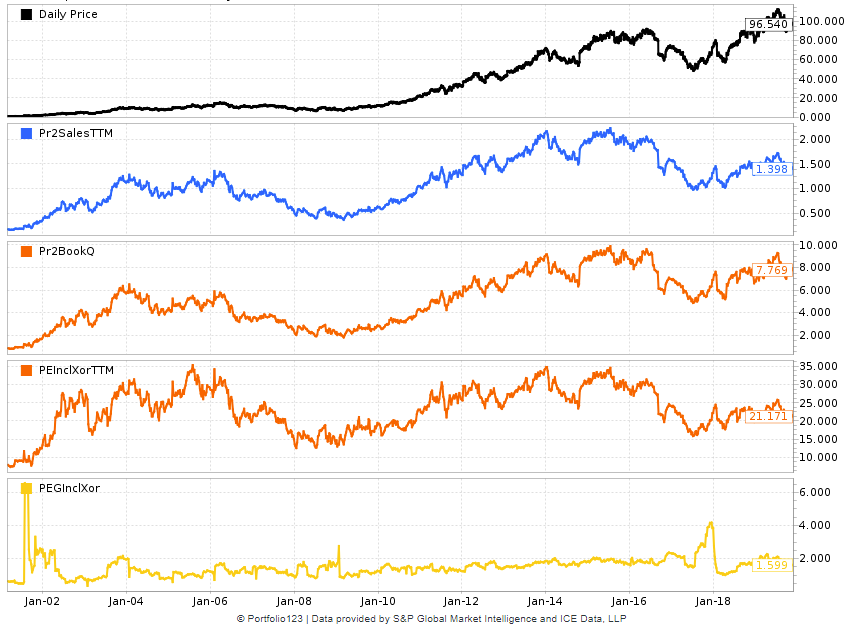
Fundamental chart:
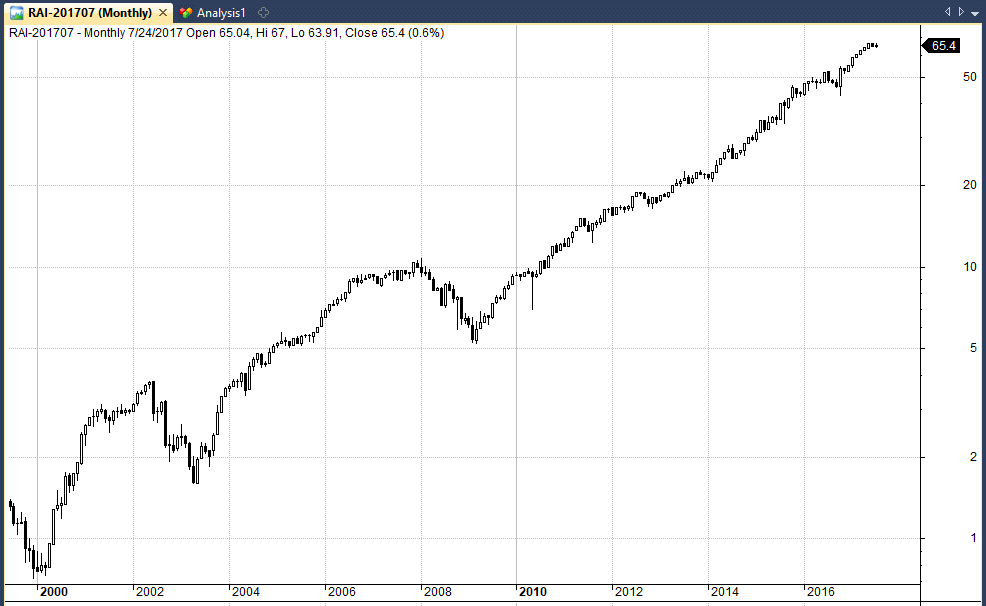
5. Reynolds American Inc. (RAI) +8,233.82%
Reynolds American is a tobacco company now owned by British American Tobacco and it’s the second-largest tobacco company in the United States.
The stock began trading publicly on the New York Stock Exchange as RAI in August 2004 before being bought out by BAT for $47 billion in July 2017 after a meteoric stock rise of over 8,000%.
Price chart:
Fundamental chart not available.
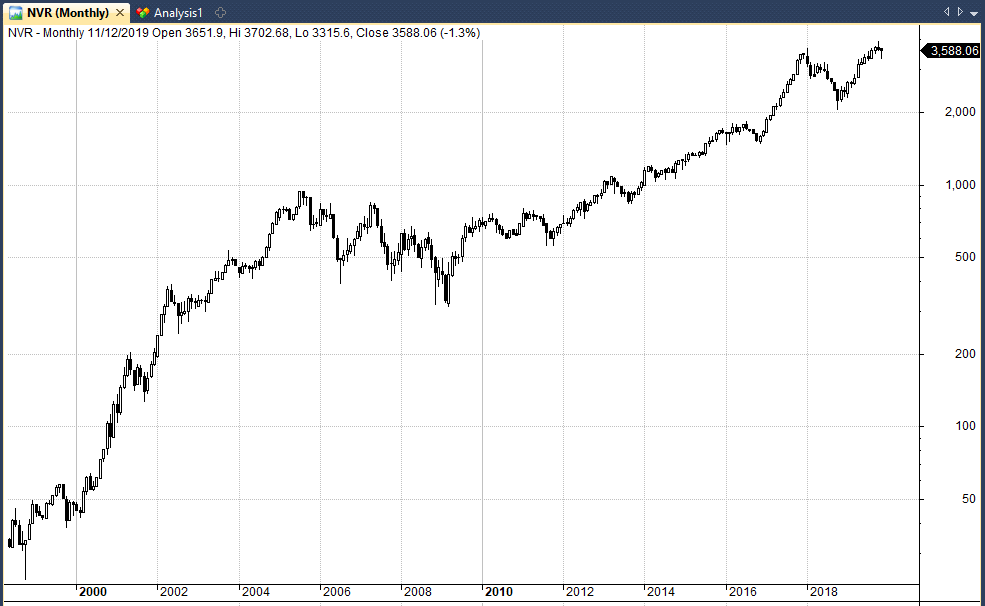
6. NVR Inc. (NVR) +7,687.87%
NVR Inc started life as NV Homes and was founded in 1980 by Dwight Schar. It was acquired by Ryan Homes in 1986 before filing for bankruptcy in 1992. The company came out of bankruptcy and was publicly listed in November 1993.
NVR offers home construction, mortgage banking and title services and is now the 4th largest home construction company in the United States.
Price chart:
Fundamental chart:
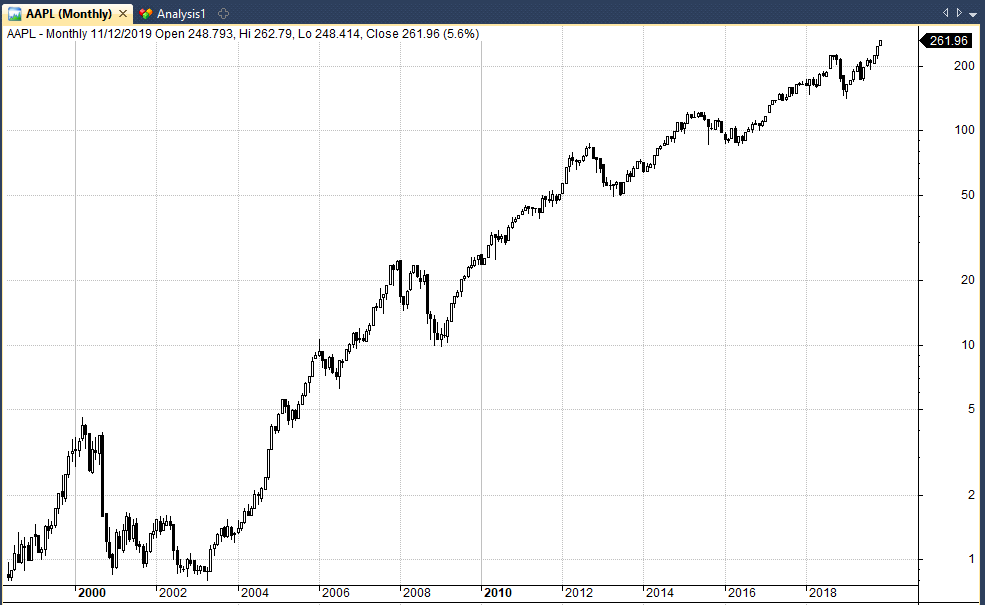
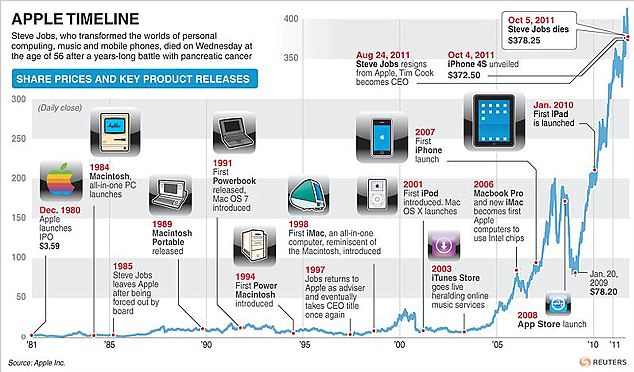
7. Apple Inc. (AAPL) +6,770.77%
The history of Apple is well known and the stuff of legend. The company was founded by Steve Jobs and Steve Wozniak in 1976 and the stock went public in 1980.
The turning point for Apple was arguably the invention of the iPod in 2001 and companion software iTunes. Apple is currently the largest company in the US with a market cap over one trillion dollars.
Price chart:
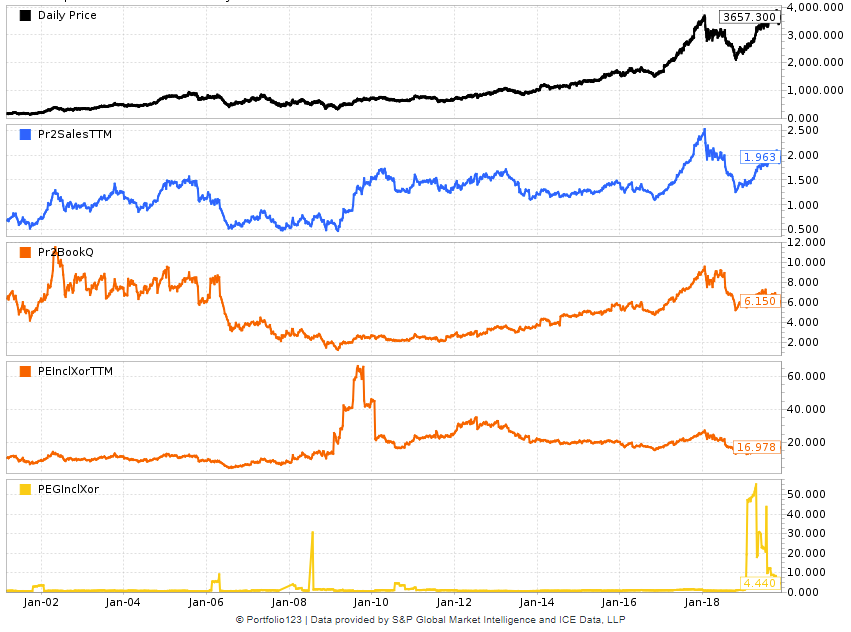
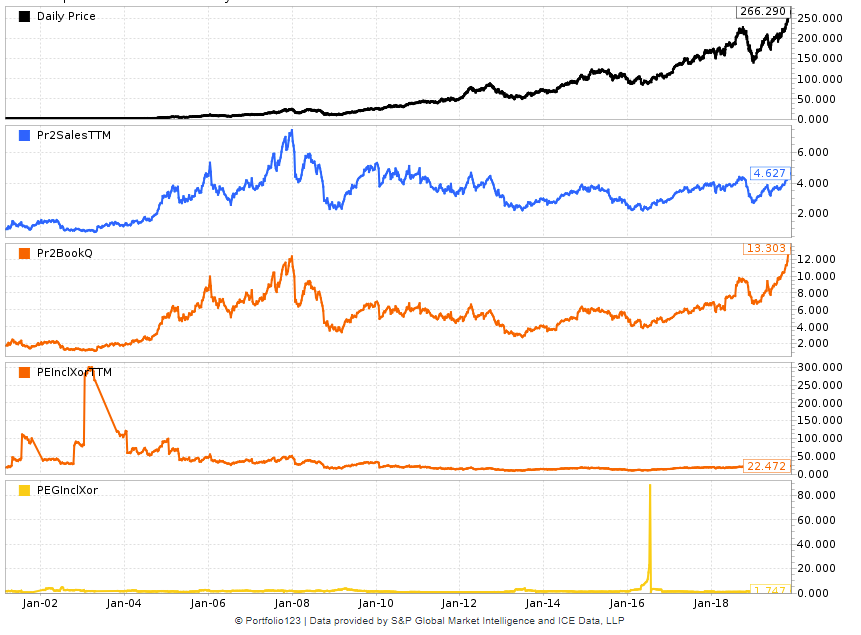
Fundamental chart:
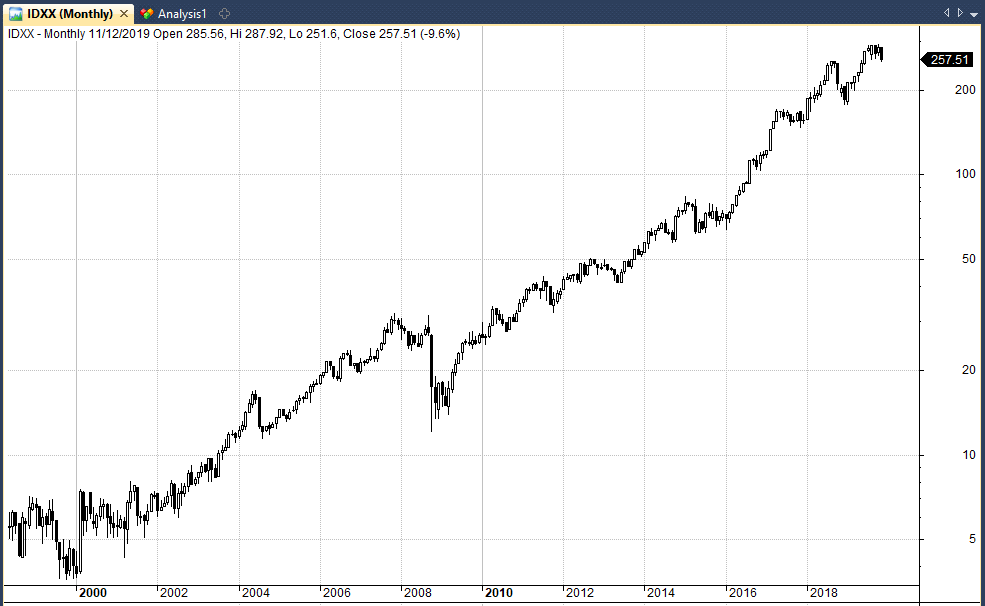
8. IDEXX Laboratories Inc. (IDXX) +6,624.50%
IDEXX Laboratories is an American multinational and leader in veterinary diagnostics, software and water microbiology testing.
The company provides numerous services and products for animals and sells product in over 175 countries worldwide.
Incorporated in 1983 the company listed on the Nasdaq in 1991 and is now a member of the S&P 500 with over 7,000 employees,
Price chart:
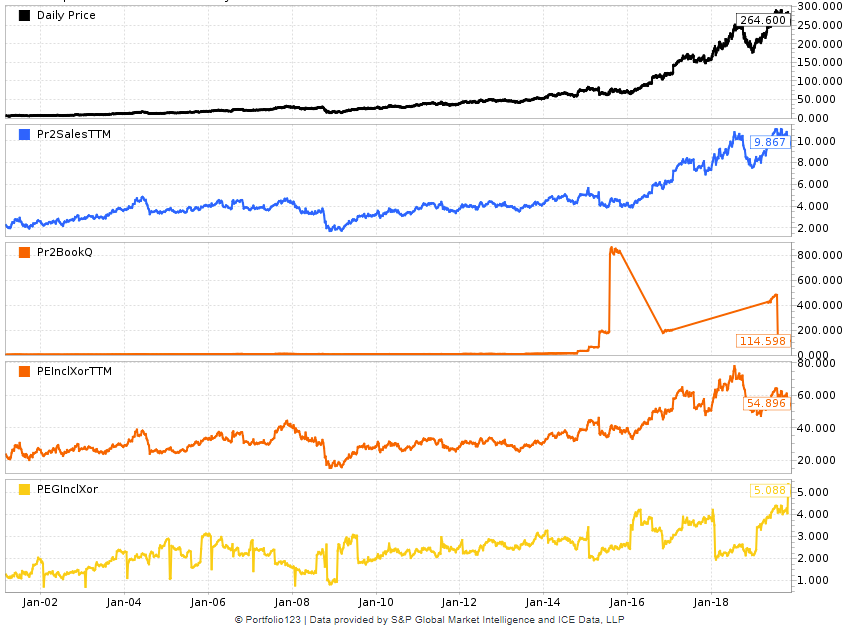
Fundamental chart:
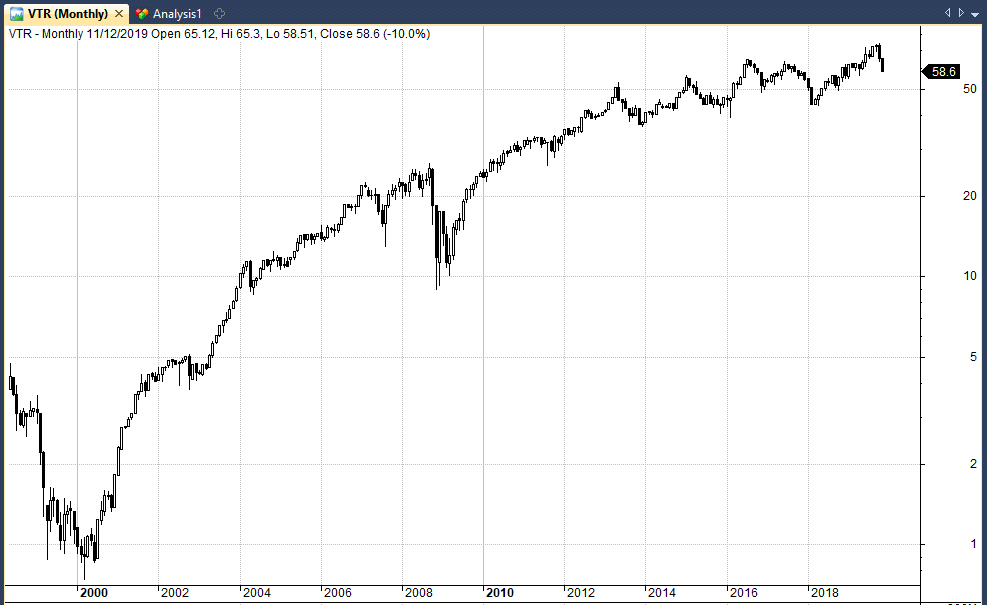
9. Ventas Inc. (VTR) +6,149.35%
Ventas Inc. is a real estate investment trust that was founded in 1998 as a spin-off of a company called Vencor. The company develops, leases, disposes and manages healthcare real estate.
According to sources, the company survived the 2008 financial crisis thanks to CEO Debra Cafaro. Her insistence on building cash reserves before the crash ensured that the company made it through successfully.
Price chart:
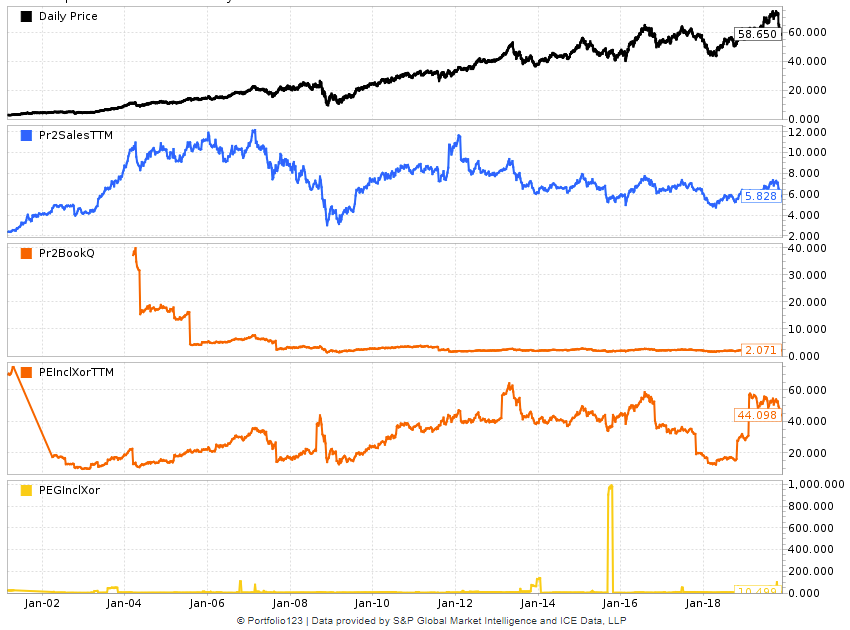
Fundamental chart:
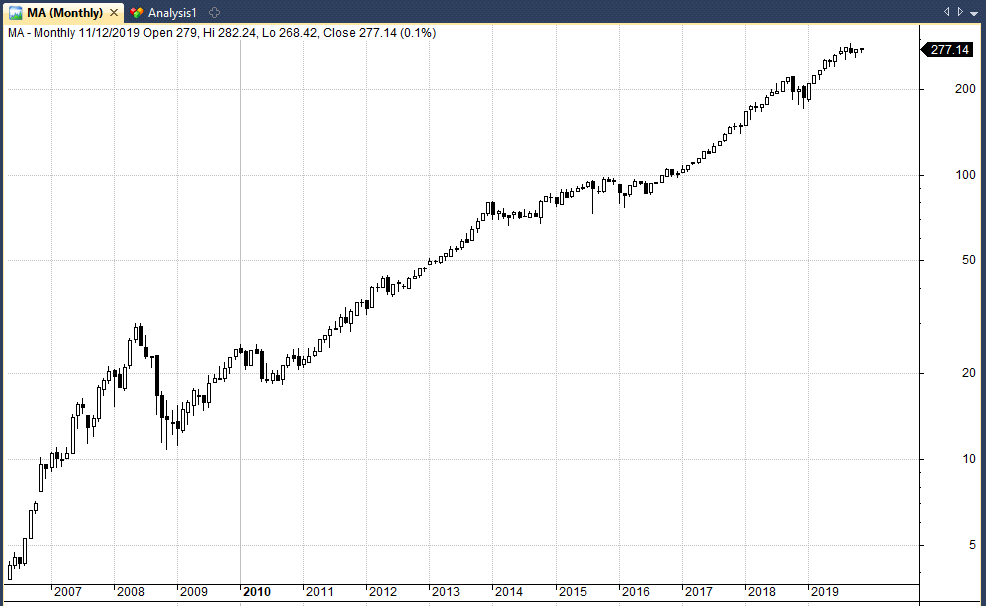
10. Mastercard Inc. (MA) +5,910.96%
The origins of Mastercard can be traced back to the Bank of America card in 1958 and the merger with Europay International in 2002. The stock entered public markets with an IPO in May 2006 at $39 a share. Since then the stock has risen around 6,000% with very little volatility.
Price chart:
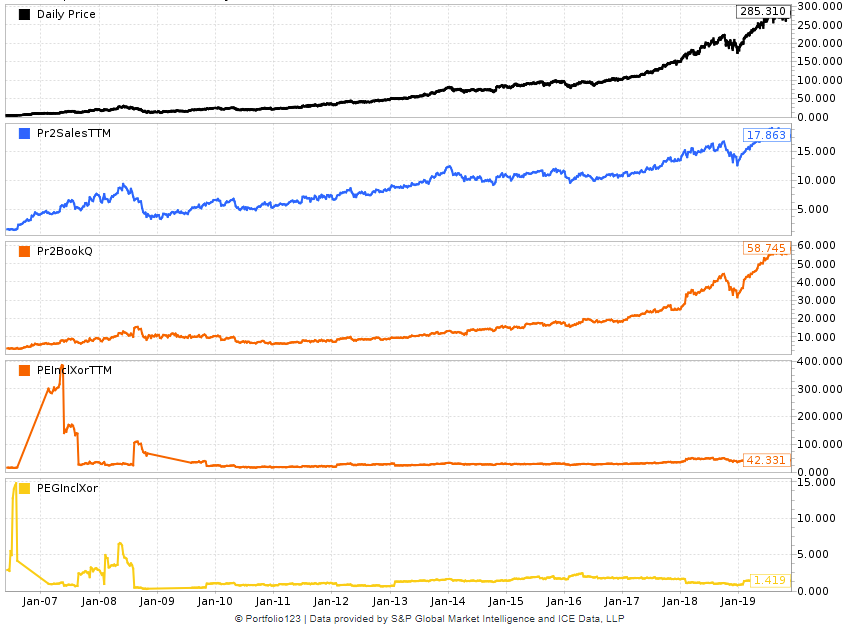
Fundamental chart:
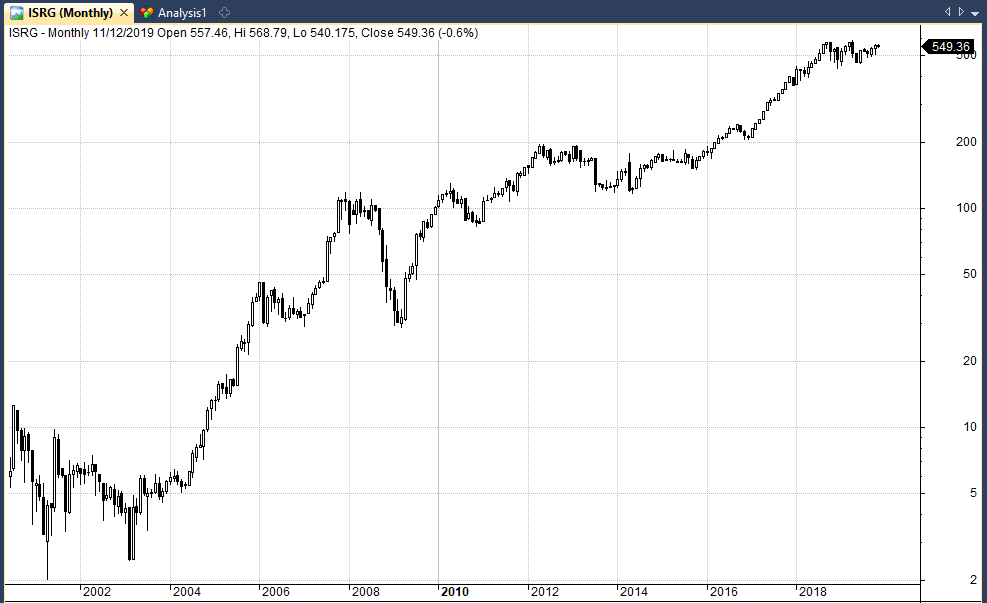
11. Intuitive Surgical Inc. (ISRG) +5,861.66%
Intuitive Surgical develops, manufactures and markets robotic products for non-invasive surgery, most notably the da Vinci Surgical System.
The company raised $46 million in an initial public offering in 2000 and got FDA approval for da Vinci the same year. The stock price really started to take off after the buyout of Computer Motion which produced synergistic benefits across the firm.
Price chart:
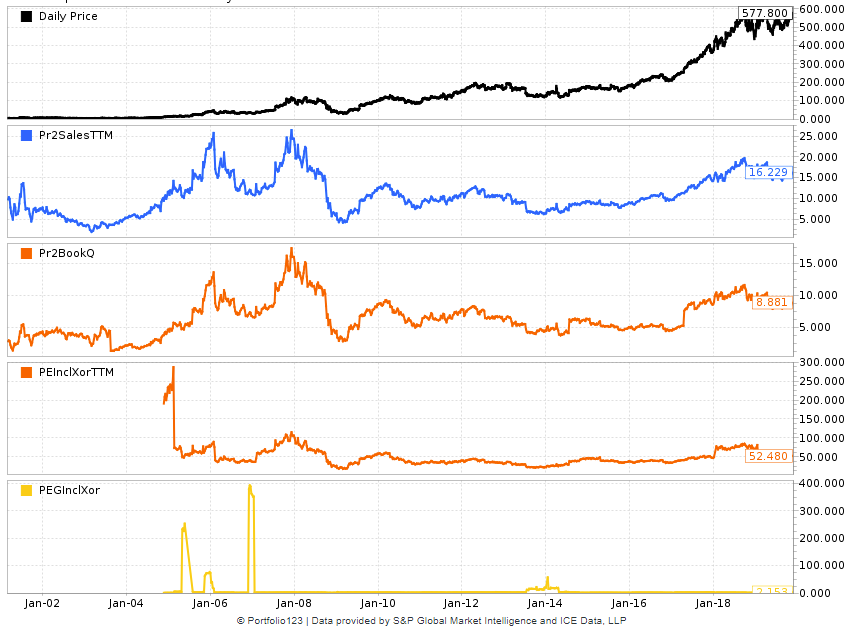
Fundamental chart:
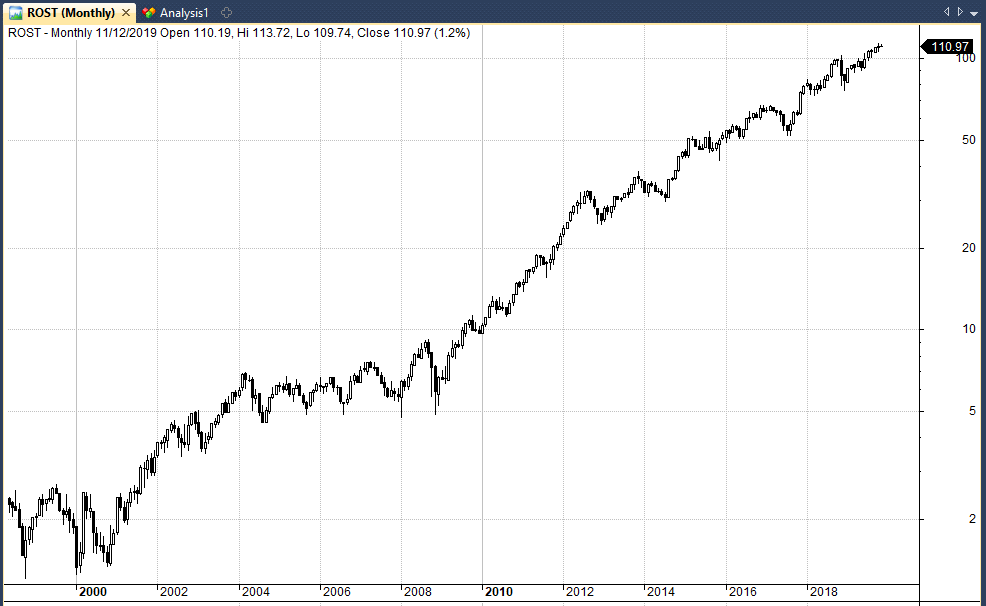
12. Ross Stores Inc. (ROST) +5,706.29%
Ross Stores operates under the brand name Ross Dress for Less and has around 1,500 stores across 37 US states.
The first Ross Department store opened in California in 1950 before the company was sold to a group of investors in 1982, rapidly expanding the business to 107 stores. The business now has a market cap of $40 billion.
Price chart:
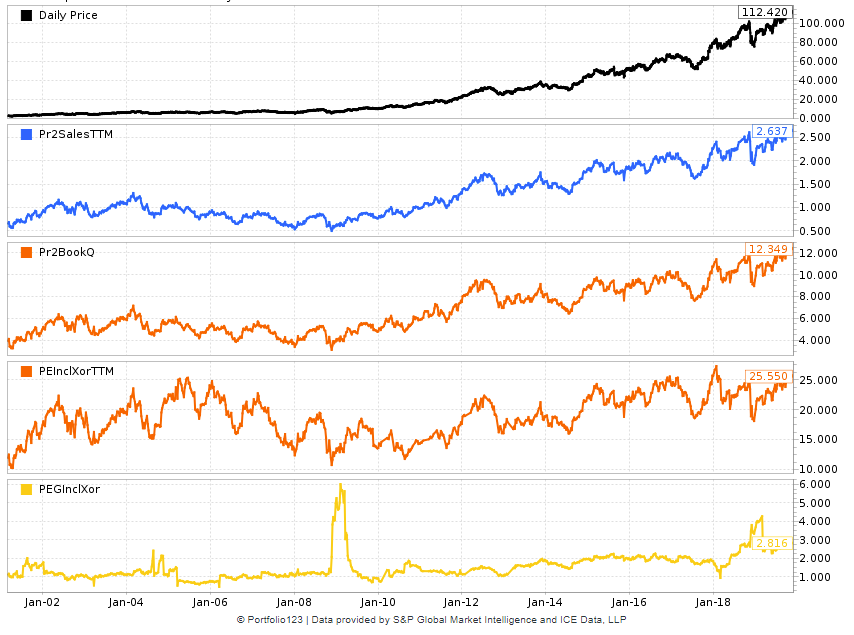
Fundamental chart:
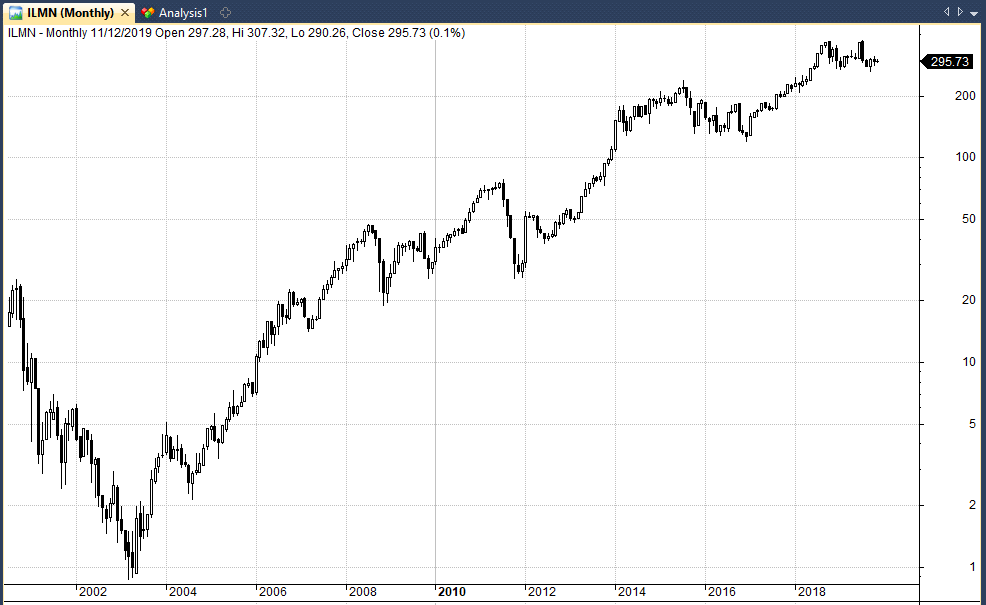
13. Illumina Inc. (ILMN) +5,538.48%
Illumina was founded in April 1998 and completed its initial public offering in July 2000. The company develops, manufactures, and markets integrated systems for the analysis of genetic variation and biological function.
The company provides a line of products and services that serves the sequencing, genotyping and gene expression, and proteomics markets.
The company acquired Solexa Inc in 2007 and has also received financial backing from Bill Gates and Jeff Bezos.
Price chart:
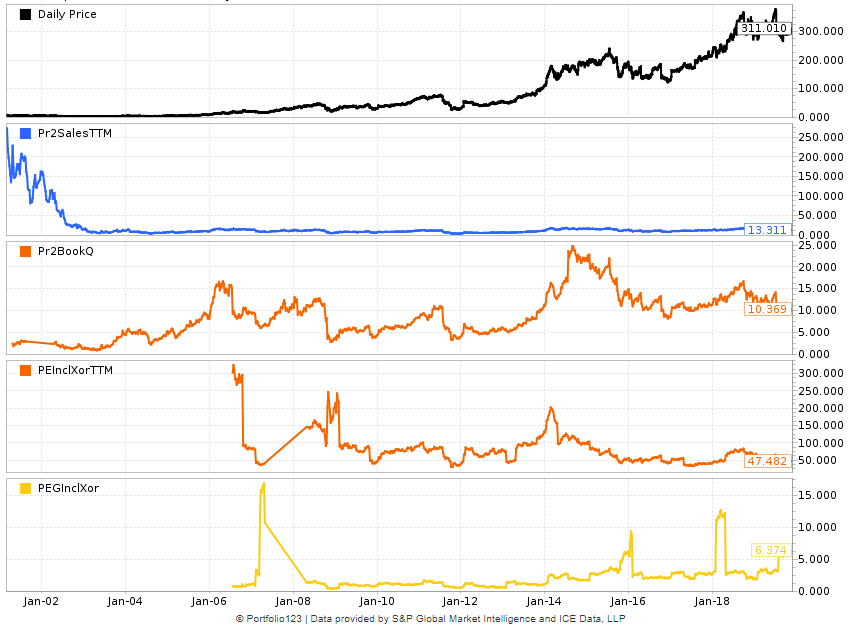
Fundamental chart:
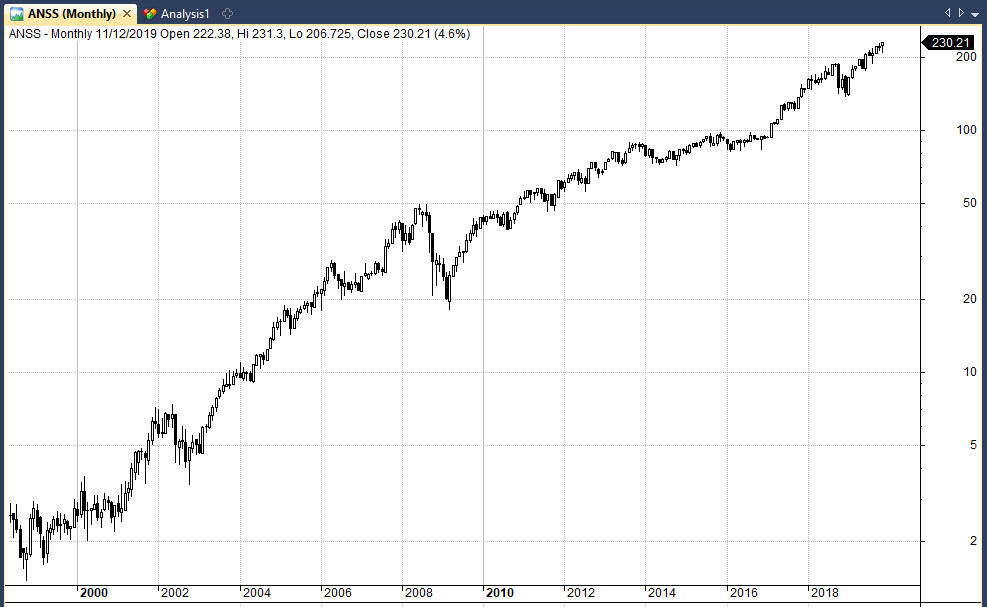
14. Ansys Inc. (ANSS) +5,023.64%
Ansys develops and markets engineering simulation software. The software is used to design products and semiconductors, as well as to create simulations that test a product’s durability, temperature distribution, fluid movements, and electromagnetic properties.
The company was founded by John Swanson in 1970 before being sold to venture capitalists in 1993 and then going public in 1993. The company made a string of acquisitions in the 2000s powering the stock to gains of over 5000%.
Price chart:
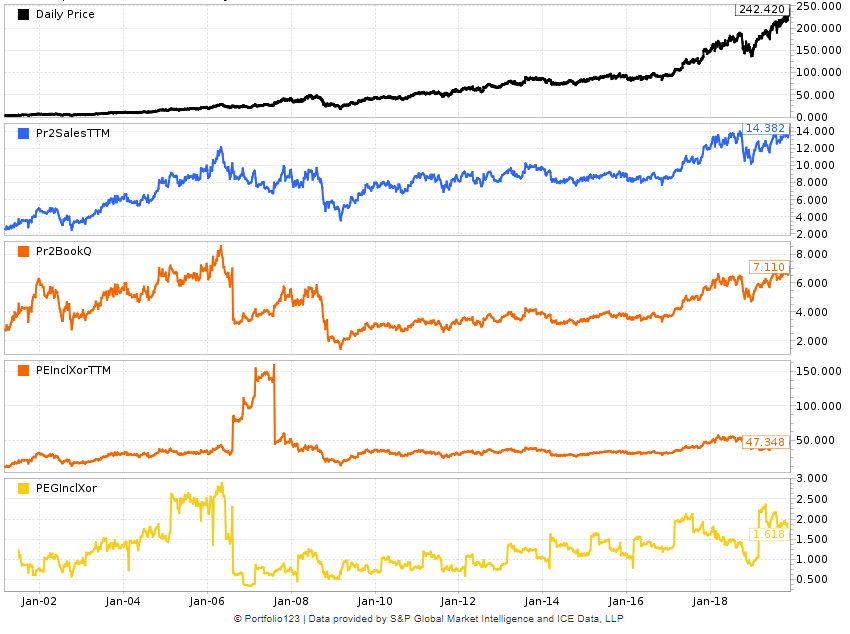
Fundamental chart:
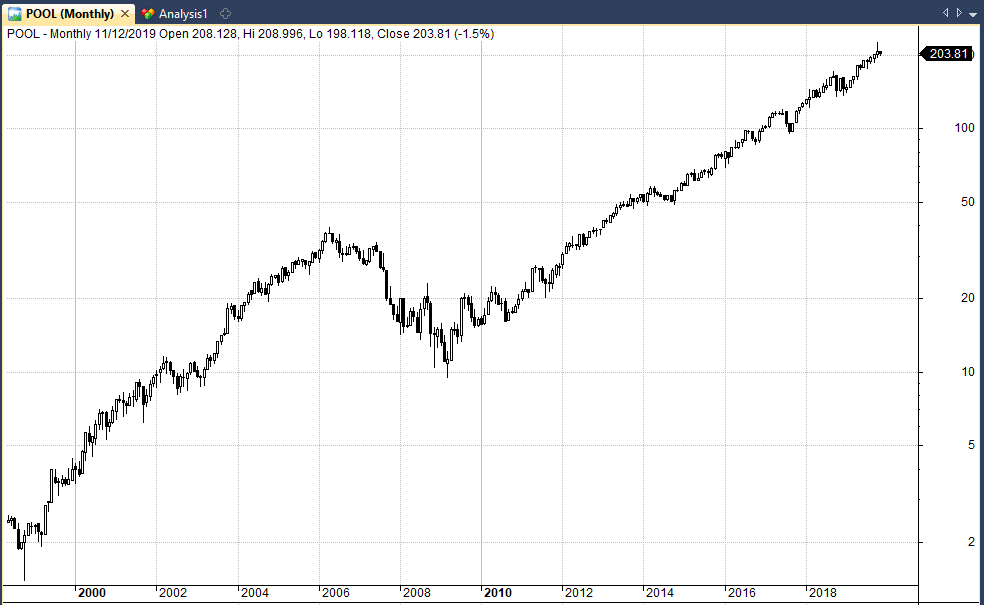
15. Pool Corporation (POOL) +4,749.64%
They say don’t mine gold when you can sell shovels and that principle applies here because Pool Corp is the world’s leading distributor of swimming pool supplies.
The company has an additional focus on irrigation, equipment, outdoor living and landscape products which helped propel it to gains of over 4,500% during the last 20 years.
Price chart:
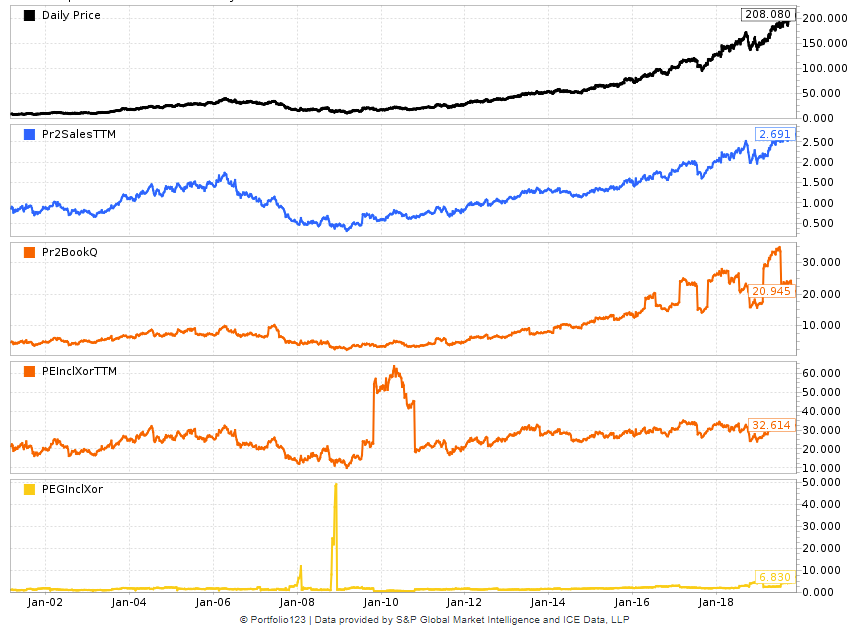
Fundamental chart:
The next five best performing stocks are: NVDA, EW, TDG, ATVI and SHOO.
Conclusions
It’s natural to look at a list of best performing stocks and ask ‘what can we learn? Are there any patterns or relationships that can help us to identify good stocks in the future?’
The truth is that there are not many obvious patterns but here are a few things I observed:
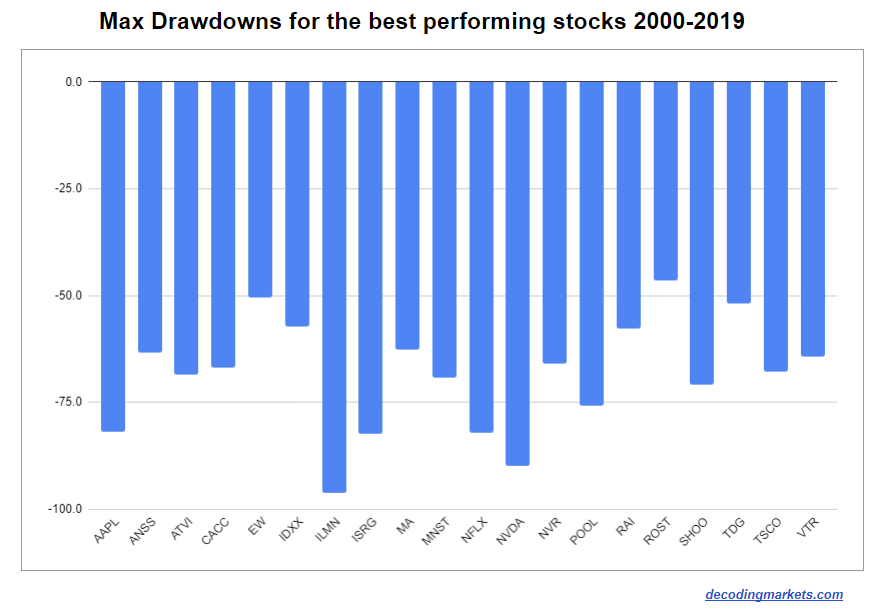
They All Experienced Big Drawdowns
Without exception, all of the best performing stocks experienced drawdowns that would make even the most hardened investor shudder.
- Apple lost 81% of its value from March 2000 to April 2003.
- Netflix lost 82% from July 2011 to September 2012.
- ILMN saw a staggering 96% drawdown in 2003.
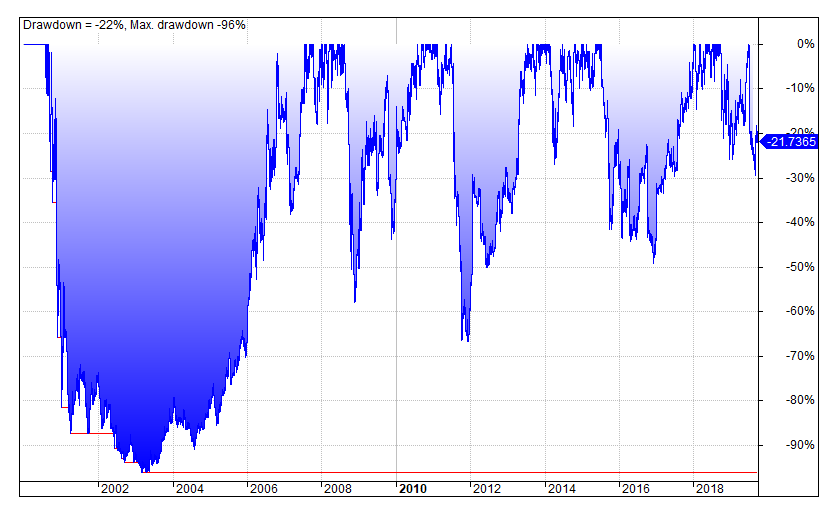
Most of the big drawdowns came during the dotcom crash and the 2008 crash. Only ROST escaped with a drawdown less than 50%.
The lesson here is that even the best performing stocks experience devastating drawdowns so investors need to be diversified and prepared to sit through painful periods.
They Span All Industries
One thing we can say is that the top stocks span all types of industries; retail, agriculture, video, real estate, healthcare, beverages etc.
This is encouraging because it means you don’t need to be an expert in one particular field to be able to pick the best stocks. There will likely be a top performing stock waiting in your preferred industry.
They Don’t Reinvent The Wheel
Another thing we can take from this analysis is that a company doesn’t need to reinvent the wheel in order to have roaring success.
With the exception of a couple of the healthcare stocks like ISRG and ILMN most of these companies have not created anything new or extraordinary.
Credit services, real estate, consumer beverages, video content, tractor parts, discount retail. These are time-old industries that have spawned profitable companies for hundreds of years.
What these businesses have done well is that they have been able to profit in time-tested niches through better management, acquisitions, synergies and better customer service.
Lesser Known Names
There are also a lot of names here that many people won’t recognize.
CACC, POOL, VTR. These stocks are rarely talked about in mainstream media even though they have produced big returns. That’s mainly because they don’t operate in hot, new industries.
So it’s clear that the best performing stocks don’t necessarily get the media attention you might expect.
Ratios Don’t Matter Much
There also doesn’t appear to be much of a relationship between a stock’s performance and a company’s financial ratios.
IDEXX Laboratories, for example, has rarely traded at cheaper than 20 times earnings (P/E) while ROST has rarely traded more than 25 times earnings.
This may be expected from these two industries but the pattern applies across the board.
In fact, if you listened to conventional investing wisdom, such as to buy stocks with low PEs, or low price-to-book, or PEGs less than one, then you would have very likely missed out on some powerful trends.
That said, when the ratios do drop to more normal ranges they do appear to have offered good buying opportunities. For example, when MNST dropped to almost 10 times earnings in 2008 it represented an excellent spot to go long.
Most Have Positive Earnings
Furthermore, if you compare the ratios of these stocks to the ratios of some of the IPOs of 2019, they do compare favorably.
Stocks like BYND and UBER, for example, continue to trade with negative earnings but most of the top stocks on this list have shown positive earnings for most of the 20 year time period.
Investors have become accustomed to the idea that loss-making companies can experience high growth. But a lot of this perception comes from the experience of one company only – Amazon.
In reality, all the evidence I have seen suggests that positive earnings companies perform better.
Price charts produced with Amibroker with data from Norgate. Price charts are log scale for better visibility. Fundamental charts from Portfolio123. Other statistics sourced from Wikipedia and company websites.
Awesome article. There is a world of wisdom in this short piece. Thank you.