The double top is a bearish chart pattern consisting of two consecutive price peaks that leads to a bearish reversal. For years, traders have claimed that the double top pattern is a high probability short setup.
This is because a double top signifies that bulls are having trouble pushing the price past the prior high. In theory, this makes some sense. The more difficulty a stock has of breaking through resistance the more chance it has of falling further.
However, there has been little statistical research done to prove whether or not this pattern has any predictive ability. And the double top is controversial since every one is different and they are very much in the eye of the beholder.
In this article, we come up with a concrete definition for the double top, code it and test the pattern on some historical data.
Coding The Double Top Pattern
Before we go any further it’s important to think about what a double top actually is and how we can write it into code.
This always presents a problem with chart patterns because they only become clear after the pattern is completed.
For example, a double top only looks like a double top after the stock hits a high then drops through the accompanying support area.
If the stock doesn’t drop fully, then it will look more like a wedge or a triangle pattern.
If the high doesn’t hold long enough then the double top pattern very quickly looks nothing like a double top at all and instead morphs into a typical breakout.
Because of this, it’s essential to come up with a mathematical formula to represent a double top.
This won’t be perfect but it will be our best bet if we want to analyse the effectiveness of the pattern.
Two Peaks And A Neckline
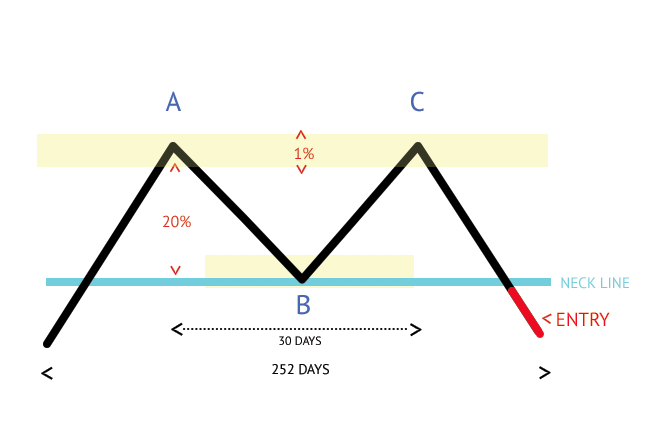
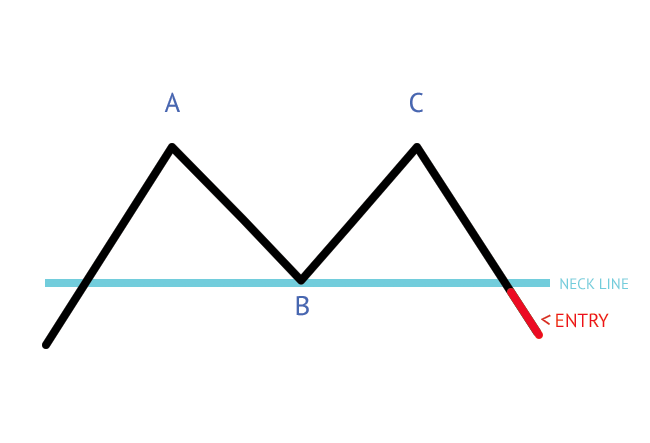
Most descriptions of a double top include two price peaks and a supporting neck line.
It is this neckline that must be broken for the double top pattern to be completed.
A typical double top can therefore be broken down as follows:
However, coding this pattern is more tricky than it sounds because we need to be specific about certain criteria such as:
- How to define the first peak A?
- How much should the high at peak A differ from the high at peak C?
- What should the distance be between the neckline and the highest peak?
- How many bars should there be between peak A and peak C?
- What is the maximum number of bars that the pattern should complete within?
The Solution
Our solution to this problem is to code up the pattern according to the points above and also make them adjustable parameters.
We can then run an optimization to see which settings work best in the context of a double top and therefore how best to trade this reversal pattern.
Importantly, the settings should be set so as to not lose the essence of what a double top represents.
We therefore decided that a double top occurs when all the following conditions are true:
- The first peak A must be the highest High price in [126,252] trading days
- The High prices at Peaks A and C must differ by less than 1%
- The lowest High price between the peaks (i.e. the bottom of the trough) must not be more than [20,30,40,50,60] % below the highest peak
- Consecutive peaks must be at least [10,20,30,40,50] bars apart
- The whole pattern must occur within [63,126,189,252] trading days to be valid
- The pattern completes after the second peak occurs and the High price falls below the lowest High between the peaks (B).
Here is a snippet of the Amibroker code we came up with:
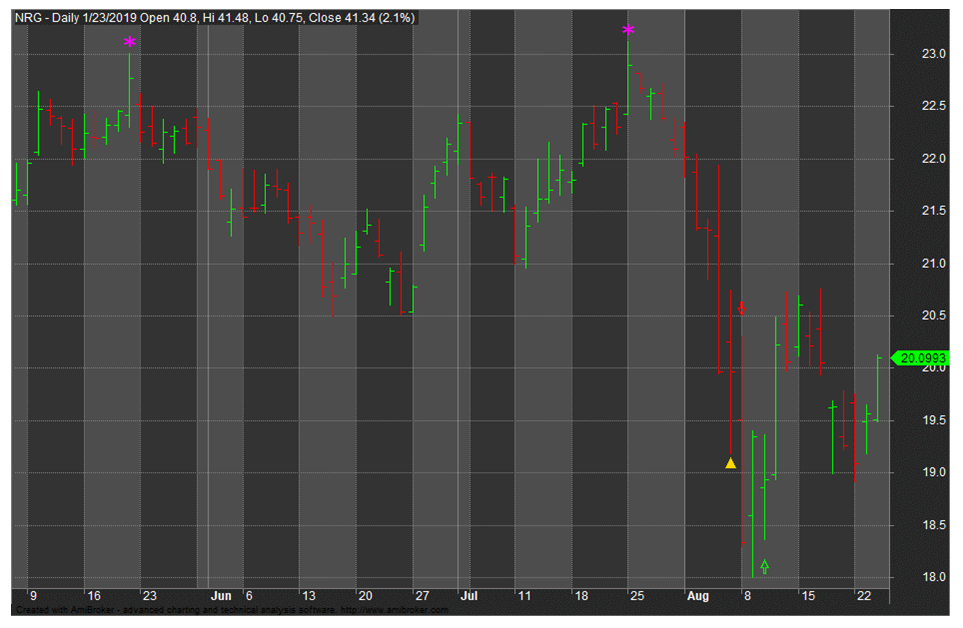
Now we can see a real example of the kind of trade setup identified with this double top code. You can see that NRG hits a first peak in May shown by the purple asterisk. It then hits a second peak on July 25th. The stock then falls back resulting in a classic double top pattern:
Backtesting The Double Top Pattern
Now we have some code written we can run some optimizations and see how the pattern performs on historical data.
But first we must define a backtest procedure and think about a baseline that we can use to compare our results.
For this analysis we decided to test the performance of double tops on all S&P 500 stocks across holding periods from one to ten days.
We also decided to use an in-sample period and out-of-sample period. This enables us to run an optimization during the in-sample segment and then test it on the cleaner out-of-sample data.
For a benchmark, we decided to compare our results to the average return for every stock in the sample with a corresponding holding period.
For example, if the average 5-day return for all stocks in the sample is 0.5% but our pattern produces an average return per trade of 2%, there’s a good chance that we have found a profitable trading signal.
The procedure for this is to each day select all stocks that are members of the S&P 500 and calculate the closing price N-days in advance and calculate the average return over that holding period for all symbols.
Using data from Norgate we did these calculations for every stock in the S&P 500 (including delisted stocks) from 1/2000 – 1/2018.
This is summarised below:
Summary Baseline Returns For S&P 500 Stocks:
- 1 Day: 0.016%
- 3 Days: 0.101%
- 5 Days: 0.184%
- 10 Days: 0.386%
You can see that the average daily return for all stocks is 0.016% (open to close) while the average return is 0.386% over 10 days. There is a slight upward bias to the results which is expected.
Note: You can also flip these results in order to see the average returns from going short instead of long. So, the average short return over 10-days is -0.386%.
Our full backtest settings can now be summarised as below:
- Test universe: All S&P 500 stocks including historical members
- In-sample test period: 1/2000 – 1/2012
- Out-of-sample test period: 1/2012 – 1/2018
- Commissions: 0
- Liquidity filter: Close > $2 and 21-day turnover > $250,000
- Holding periods: 1-day, 3-day, 5-day, 10-day
- Execution: Enter short position on the next day open after the pattern completes. Exit position on the close of the corresponding day
- Baseline: Average return for all stocks in the sample by holding period
Double Top Pattern Backtest Results
In the next table you’ll be able to see the results of our optimization during the in-sample period.
We are optimizing four strategy parameters here and looking for the best combination during the sample period between 1/2000 – 1/2012.
We have also filtered out any results that have less than 150 trades because we want to have a decent enough sample size.
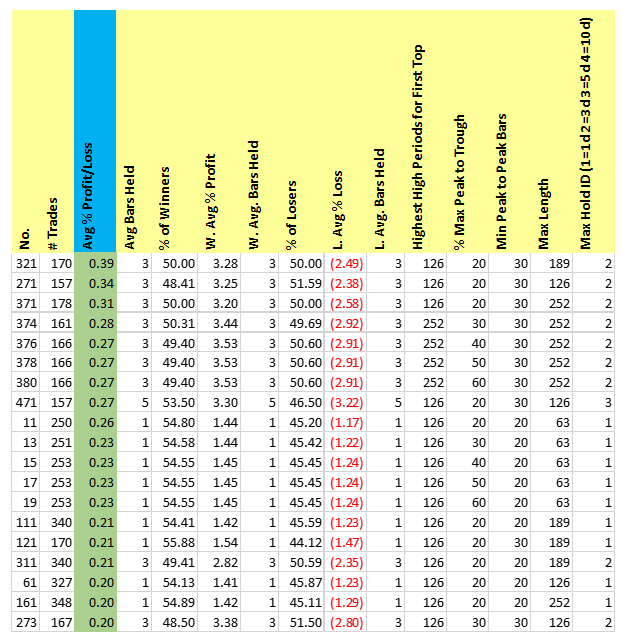
You can see from the above that some variations of our double top pattern have a slight edge with an average profit per trade of up to 0.39%. You can also see that some variations have win rates as high as 56%.
Any variations with more than 150 trades and an average profit per trade >= 0.20% are highlighted green.
The best performing variation #321 produced an average profit per trade of 0.39% with a 50% win rate. This double top pattern had the following settings:
- Max 1% difference between peak 1 and peak 2
- Peak 1 is highest in 126 days
- 20% max peak to trough
- 20% min peak to peak bars
- 189 bars max length
- 3-day holding period
Comparison With Out-Of-Sample Results
We have seen some small profits during the in-sample optimization, the next question is do these same variations hold up in the out-of-sample test period?
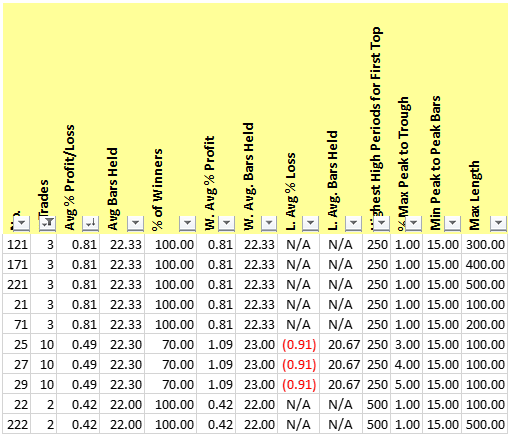
In the next table in-sample data for Avg % P/L has been added and the OOS results are sorted based on the highest IS Avg % P/L.
You can see that of the 19 variations with the highest in-sample average profit per trade (highlighted green) only two achieved an average profit per trade over 0.20% in the OOS test (highlighted yellow):
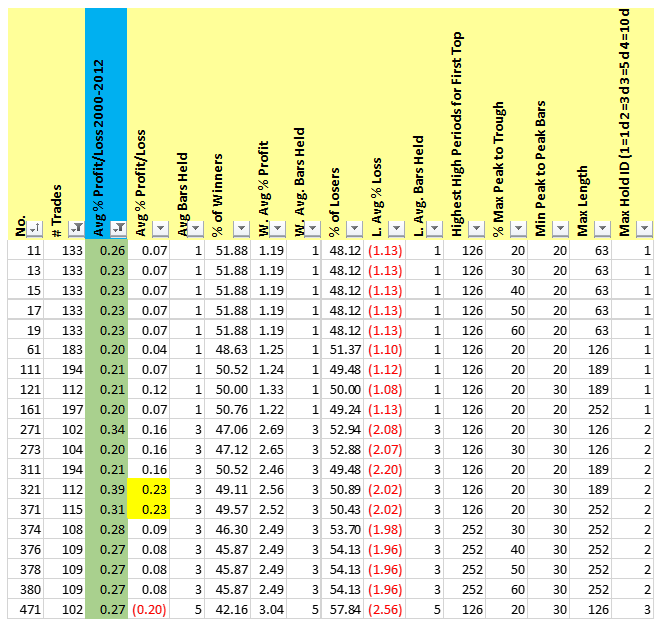
For example, variation #321 produced an average profit of 0.39% profit in-sample and a profit of 0.23% out-of-sample with a 3-day holding period.
This compares to an average 3-day short return of -0.101% for all stocks in the sample. We get this from our baseline result, implying there’s a small element of profit but not much.
Conclusions So Far
Overall, with a fairly low average gain per trade (even before commissions) and also a small number of trades (10-30 per year), other significant improvements would be required to turn this into a profitable trading strategy.
There may be some benefit to a double top formation as a hedge to a long strategy but profits of only 0.2% are unlikely going to cut it when we introduce commissions and slippage.
Also, it appears hard to predict which parameters will be successful in the future. There’s not enough profit and not enough stability in the results to be confident in this pattern.
One positive conclusion we can make is that short trades seem to work better over short holding periods – 3 days or 1 day. This information might be useful for a future experiment.
Should You Trade It Intraday?
Before we wrap up, I also wanted to run some analysis on intraday markets to see if double top reversal patterns are more profitable on higher frequency data.
For this, I tested 15-minute time-frames for five major ETFs; SPY, QQQ, GLD, USO and TLT.
For these tests, we had to make a few changes to get reliable results and find entries that still look like double tops.
The code for the second peak was altered so that it must occur within 0.1% of the first peak.
The other difference was that any short trade must be placed before 2pm and all trades are exited on the close at 4pm.
This is because we want to keep this test strictly to an intraday timeframe.
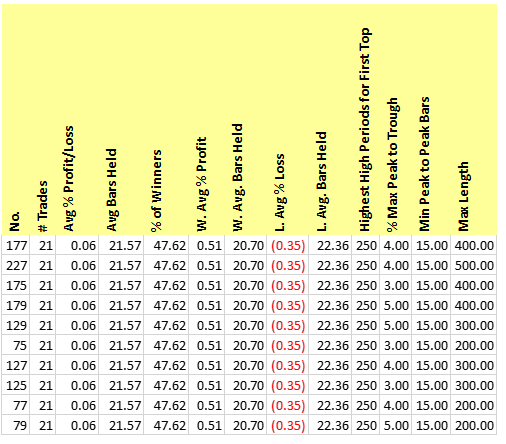
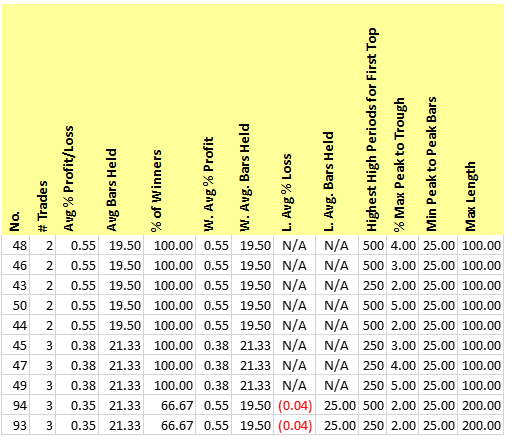
The tables below show our top 10 optimization results for different ETFs:
SPY 15-minute:
QQQ 15-minute:
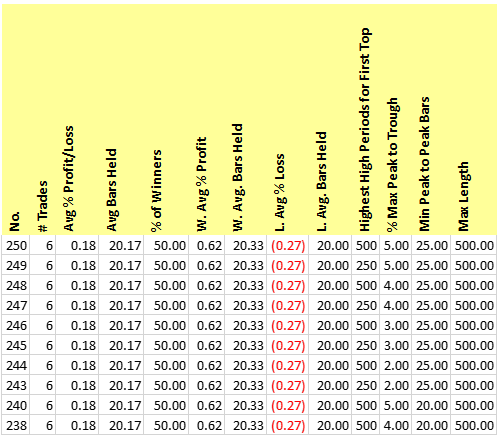
Our best avg profit per trade was 0.18% trading the 15-minute chart for QQQ.
GLD 15-minute:
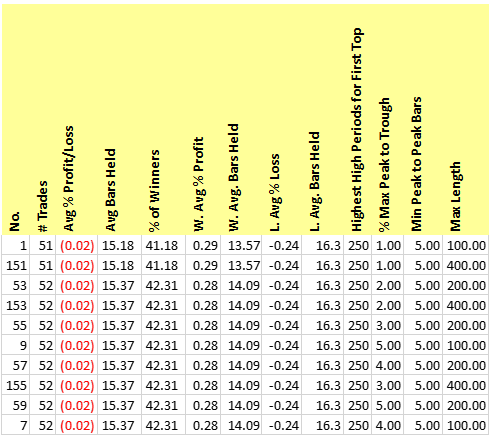
We did not find any profitable variation trading the 15-minute chart for GLD.
USO 15-minute:
Our best avg profit per trade was .81% trading the 15-minute chart for USO however this was a very small sample size of only 3 trades.
TLT 15 minute:
Our best avg profit per trade was .55% trading the 15-minute chart for TLT however this was also a small sample size.
Intraday Conclusions
Unfortunately the answers are again disappointing for this analysis (with the exception of USO).
For example, you can see that for SPY the best performing pattern produced an average profit of only 0.06% per trade while we found no profitable setup for GLD at all.
This is quite unusual for an optimization and we were struggling to find enough trading opportunities for this symbol.
Meanwhile, USO produced profits up to 0.81% per trade but the sample sizes were also small so more investigation would be needed.
Final Thoughts On The Double Top Pattern
The difficulty with analysing trading performance is that it’s a numbers game. There will always be some winners due to the nature of statistics. It doesn’t follow that results are necessarily borne out of skill or a found edge.
We often hear traders talking about winning reversal patterns like double tops and head and shoulders but time and again we test these patterns and find very little evidence of profitability.
There can only be 3 reasons for this dissonance:
- Some traders make money from these patterns but they’re profits are actually due to luck and not chart reading.
- Some traders make money from these patterns but they are incorporating other tricks and secret sauce that helps them to win.
- Traders are deluding themselves and actually not making money from these patterns at all.
All three reasons are perfectly believable and I have witnessed them numerous times through my years of trading.
Looking at the results of the double top, this is not a pattern you want to be shorting on its own. The results simply aren’t good enough. But if you are not convinced, don’t let this analysis stop you as I am happy to be proven wrong.
The real conclusion is that to trade double tops successfully you need to have something else going in your favor. Some news, or other source of edge. You can’t trade the pattern alone and expect to get rich.
Notes: Simulations in this article produced in Amibroker with data from Norgate. Intraday data from Esignal. Also thanks to Matt Radtke for his assistance with this article.
Thanks for the analysis. I agree that traders often do things that have a perceived edge but don’t test their theories thoughtfully in live market conditions. One issue that concerns me be about your results is the entry and exit criteria. Your entries seem to be quite late and your system exits quickly. Adjusting your entry and exit criteria could have a massive impact on returns.
This type of trading set-up also has a big discretionary component. For example if a trader has seen hundreds or thousands of double tops in their trading career, they may know which ones have a higher priority and which ones to skip. They may have fine tuned their entries and exits to suit each setup based on experience. The difficulty is that the discretion cannot be accurately tested.
Sure, totally agree with you there can be a discretionary element, that’s what I tried to mention in the closing statement. Traders might have tricks, secret sauce etc that helps them pick the winning patterns from the losing ones. The only problem here is that, statistically, those winning discretionary traders may just be lucky traders. This is what a lot of other analysis has tried to prove over the years.
Not sure I agree with you re: my entries and exits. Entries were placed at the earliest point after the pattern completes (not counting pre-market). Plus, 10-day exit is considered quick?
Hola, podria publicar la parte del codigo que falta en la ejecucion del doble techo, no soy capaz con ese trozo de hacerle funcionar, precisamente me gustaria hacerlo al contrario que al testear el punto bajo del doble techo de señal para entrar largo con objetivo el punto alto, pero no se programarlo. y con ese trozo de codigo casi esta
Sorry but I don’t have the time to debug individual formulas. As far as I know the code is working so not sure what your problem could be. Thanks.
There are a few variables that may greatly change your results. First is support and resistance levels. A double top into heavy resistance will have a much higher chance of success. Second is velocity. A double top that forms after a parabolic move or overextension will have a higher chance of success. Double tops after a slow grind are less likely to reverse significantly, and more likely to end up in a breakout. I think most discretionary intraday traders are looking for these other variables before pulling the trigger. Just food for thought.
Good article. Is it possible to get full code to run and test? Thanks
Code for the pattern is shown inside the article. Thanks.