The past couple of years has seen a surge in retail trading which is affecting the market in a real way. People were stuck at home because of the pandemic. Add stimulus checks and volatility and you have the perfect ingredients for an increase in retail trading.
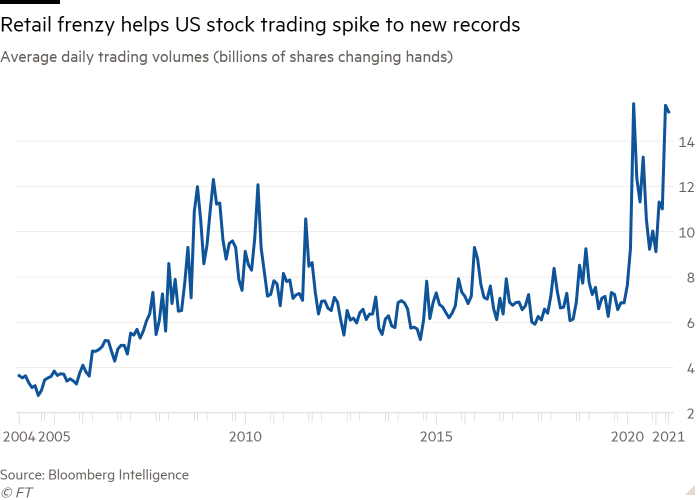
Data from Bloomberg Intelligence backs up this theory. You can see that average trading volumes decreased after 2010 then picked up significantly in the 1st quarter of 2020:
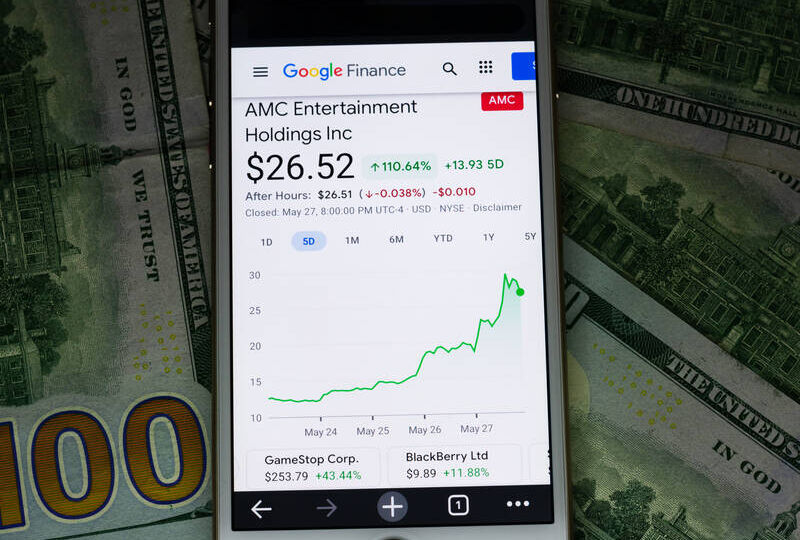
The rise in retail trading has had a direct effect on the movements of markets. Everyone knows about the short squeezes in GameStop and AMC but there have been other effects too.
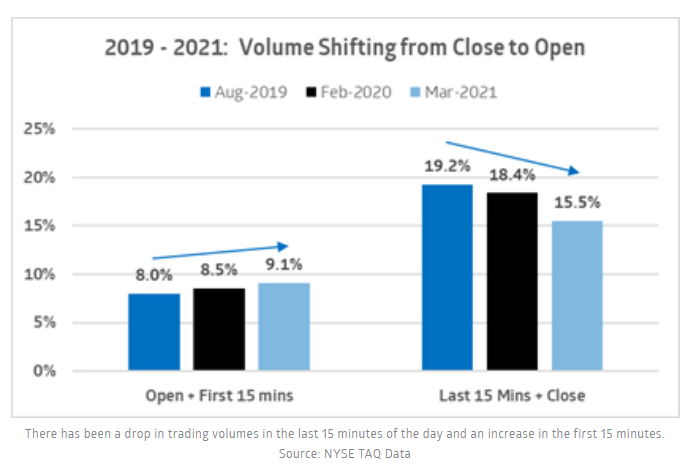
Cowen notes that retail trading has led to more intraday trading, with more volume being directed towards the open (instead of the close).
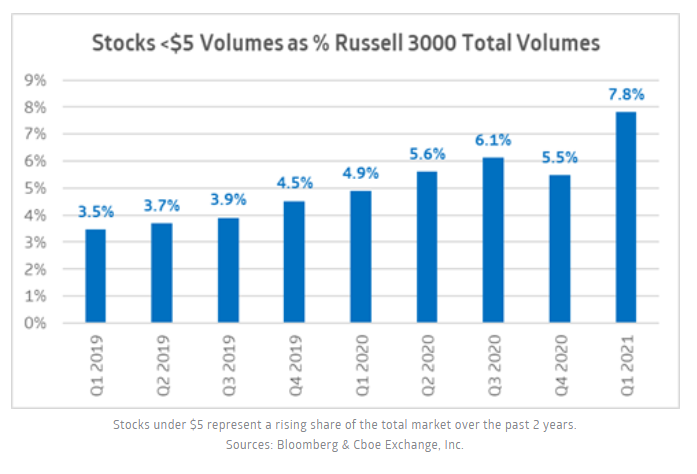
There have also been notable increases in options trading and a greater focus on stocks trading under $5 a share.
How To Take Advantage
Retail traders are having an impact, but taking advantage of this trend isn’t always obvious. The graph below from Vanda Research shows how retail trading themes change frequently. There is an element of randomness that means finding the right strategy is not straightforward.
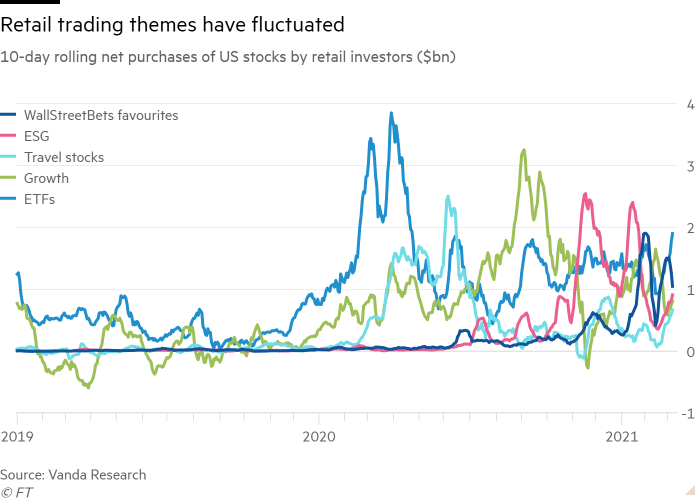
As a result, attempts to front-run retail traders often backfire. Locating meme-type stocks in advance (typically low priced stocks with high short interest) doesn’t always work. Equally, jumping on board the latest meme can end in tears when the stock inevitably falls back down to earth.
Retail Trading Activity From Nasdaq
One solution to this problem is to be more scientific in how we analyze retail trading flows.
To do this I went looking for some data that we can use to analyze retail traders. I came across a new dataset called the Retail Trading Activity Tracker from Nasdaq. This dataset tracks over $30 billion of trades daily to give an idea of what retail traders are trading. The data covers over 9,500 US stocks and comprises two scores; activity and sentiment.
Activity is the Ratio of $USD traded by retail investors in a given ticker divided by total $USD traded by retail investors across all tickers. This field has a value that ranges from 0 to 1.
Sentiment is derived from the retail net flows (buy-sell) from the most recent 10 trading days. The score has a range from -100 to + 100. The more positive the score the greater the proportion of retail buying.
In other words, activity tells you what retail traders are trading and sentiment tells you whether they are bullish or bearish.
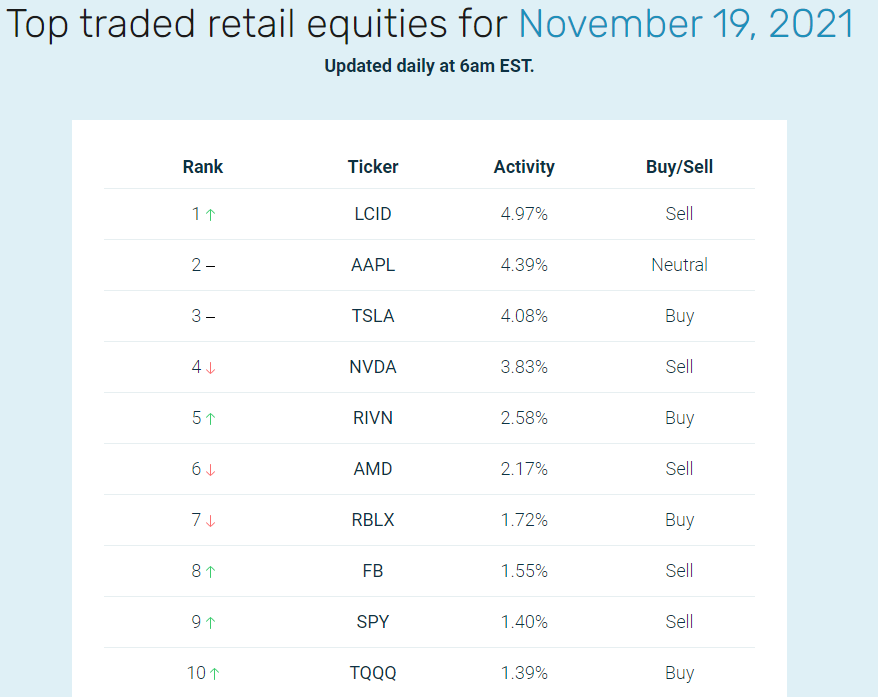
Nasdaq publishes a free daily list of the top 10 traded retail stocks on its website.
You can see that the top traded ticker among retail traders on November 19th 2021 was Lucid Motors (LCID) and the sentiment was negative. This means retail traders were net sellers of Lucid.
Preliminary Analysis
My first instinct with this data was to look for a strategy that buys high activity stocks with high sentiment scores. These are the stocks retail traders are chasing, namely GameStop and AMC.
However, in the case of GameStop in particular, you will find that retail sentiment was actually negative in the run up. Retail sentiment only turned positive after the stock had already made it’s spike upwards. Indeed, the best time to buy GameStop was when sentiment was negative and activity was increasing. This is shown in the chart below:

Although there are exceptions (AMC for example has high sentiment directly before it’s June run) it’s clear that buying high sentiment stocks is not necessarily the best strategy.
As a result, I focused on a strategy that does the opposite — buys stocks with negative sentiment and sells them when retail sentiment turns positive.
Fading Retail Traders Strategy
The rules of this strategy are to buy the 10 highest activity stocks that also have negative retail sentiment (according to the Nasdaq Activity Tracker). Then sell when retail sentiment turns positive.
The idea is that activity shows us when a stock is gaining interest. Negative retail sentiment indicates that we are getting in early on the trade. When retail sentiment turns positive it’s an indicator that retail traders are now flocking to the trade and it’s time to book profits.
To test this strategy, I downloaded the historical retail data from Nasdaq and combined it with Sharadar daily price data for 6500 US stocks. Then I created a simple portfolio strategy.
The system was first run using an in-sample period between 2017-2020. My first exploration was profitable so I proceeded to backtest the full sample between 1/2016 – 10/2021.*
Example Trade Setup
The following chart shows an example trade setup in Zoom Video Communications (ZM):
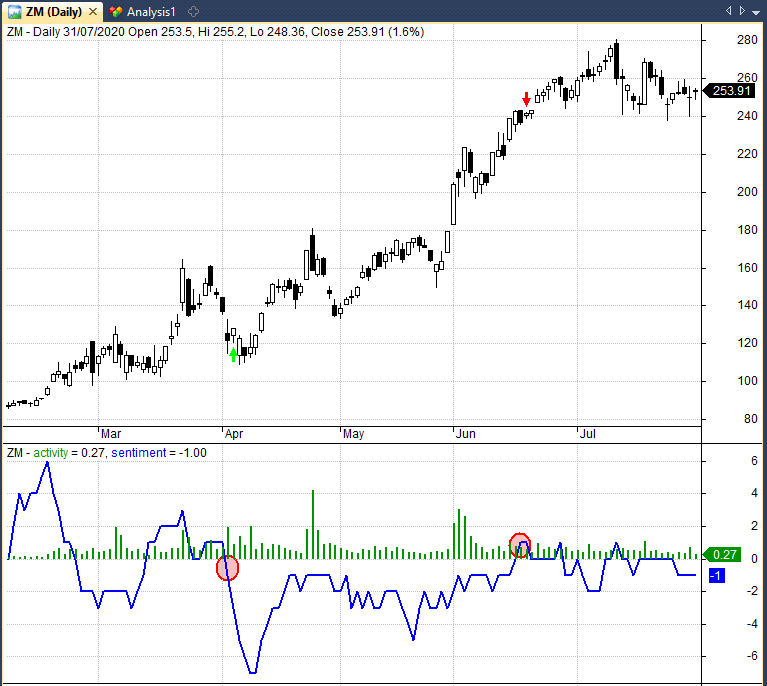
You can see that the activity score (green bar) on 2nd April 2020 is 1.92 which puts the stock into the top 10 highest activity tickers at the time. This score suggests that nearly 2% of all retail trading activity was in ZM.
Sentiment (blue line) has also turned negative with a -1 score. We therefore go long on the next open at a price of $124.3 (green arrow). 53 days later, retail sentiment turns positive. We therefore exit on the next bar open at a price of $240.39 for a for a 93.38% profit after fees (red arrow).
Backtest Results
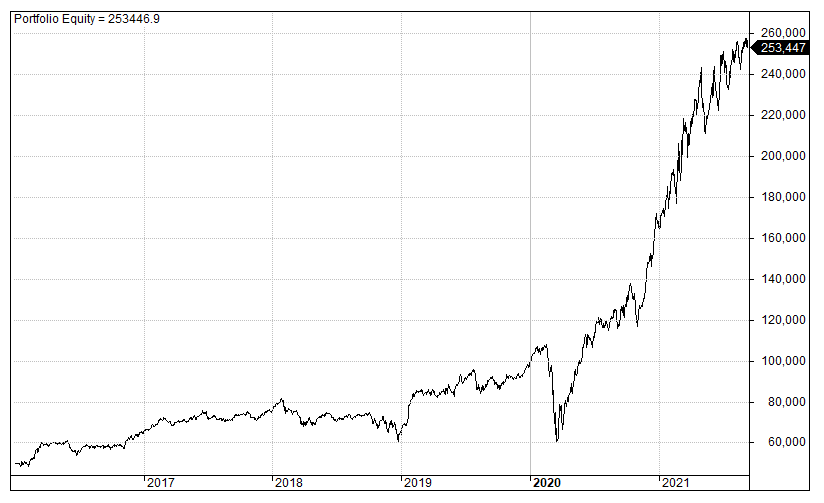
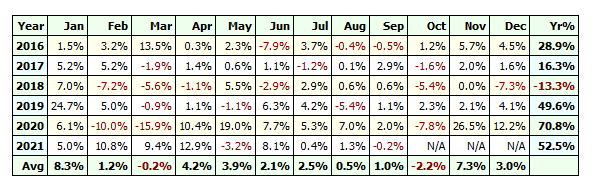
Backtesting this system on the full sample period between 1/2016 to 10/2021 we recorded the following backtest statistics, equity curve and profit table:
- # Trades: 1467
- Net profit: 406.89%
- CAR: 32.97%
- RAR: 33.67%
- MDD: -43.52%
- CAR/MDD: 0.76
- Win Rate: 53.78%
- Avg Duration: 10.7 days.
- Profit Factor: 1.68
Initial Observations
Over the period between January 2016 and October 2021, we recorded an annualized return of 32.97%. Our win rate was 53.78% and our maximum drawdown was -43.52%. We placed 1467 trades in total and scored a return-to-risk of 0.76.
One thing I like about this strategy (apart from the good return) is the simplicity. We are using just a couple of rules, zero optimization and we are not predefining any parameters. This is typically a good sign of robustness.
I also like the average trade duration of just 10.7 days. This is a good length for swing trading and should make the strategy a good complement to other strategies. For example, longer term trend following.
It should be noted that I have not spent that many hours on this strategy. More sophisticated position sizing, portfolio optimization or additional rules could very well improve our results further.
Final Thoughts
I found that this sentiment data from Nasdaq was more useful than the sentiment data I previously analyzed from InfoTrie. In that previous analysis it was more difficult to find a profitable result so I believe that the Nasdaq data contains more signal.
That said, the data from Nasdaq is not perfect. For small cap stocks with low retail activity there is a lot of noise in the sentiment score that makes it hard to use. Because of this, our strategy spends a lot of time invested in well known names like Tesla, GameStop and Apple. It does pick out some small caps, but less frequently.
The results, however, are strong and suggest there is money to be made from fading retail trading activity. The conclusion is that taking profits is often a good idea when retail traders all turn bullish on a stock.
That being said, I don’t suggest this is the only way to utilize retail data. There may be better ways to follow retail trading activity and there are many other ideas to try.
Additionally, we should keep in mind that we are using a relatively small sample size during a time when retail trading is very active. We should remember that retail trading activity could easily fade away in the coming years, especially if stocks enter a new bear market.
Notes: *All trades are entered on next day open following the trade signal with commissions of $0.01 per share. Starting capital was set at $50,000 with a maximum portfolio size of 10 positions and equal weighted position sizing (10%) no leverage. Price data from Sharadar and activity data from Nasdaq. Price data is adjusted for splits and dividends. Simulations and charts from Amibroker.
Interesting analysis. How do I download the data into amibroker with the price data included as well? Are there delisted stocks? Is this covered in your course?
Sharadar does include delisted stocks although I’m not sure how many delisted stocks there have been in the last few years. The best method I’ve found to use this type of data is to manipulate the data first in R and Excel and then import into Amibroker that way. My latest course HTS Part Three will cover this and will be published soon. Thanks for your comment!
Great stuff.
One question: are you including ETFs, or just single stocks?
Good question, which I forgot to mention. We filtered out ETFs.
Good job which illustrates the proverbial expression : “Buy fear and sell greed” !