
There’s a study that has been doing the rounds for some time called “Do Global Stocks Outperform Treasury Bills?”
In the study, the authors come to the conclusion that most stocks fail to beat the return on cash (1-month Treasury bills).
In fact, across a sample of 62,000 global stocks between 1990-2018, 56% of US stocks and 61% of non-US stocks underperform one-month US Treasury bills.
This is quite a damning headline.
If most stocks fail to return even a couple of percent a year it makes you wonder why would anyone want to invest in the stock market in the first place?
Should You Bother With Stocks?
Well, it’s not all bad news.
It doesn’t grab the headlines but the authors also mention that taken as a whole, the return on stocks greatly exceeds Treasury bills.
They report total buy and hold returns in global stocks of 0.96% monthly, 14.11% annually and 95.62% by the decade. This is much higher than the buy and hold returns on cash.
It comes down to the fact that stock returns are positively skewed so a small percentage of firms make up a large proportion of total returns.
So the chance of one stock outperforming cash is poor but the chance of a basket of stocks is much better.
But one problem with this research is that it looks at the entire universe of global stocks and treats them all the same.
In fact, the majority of global stocks are small caps. In the US, for example, there are over 23,000 public companies and about half are micro caps.
Most people are aware that micro caps carry more risk and if you compare stocks by size, you find that most large cap stocks outperform T-bills while most micro cap stocks do not.
Not All Companies Are Equal
The problem with this paper is that someone who only reads the abstract could come to the conclusion that stocks are too risky to bother with.
When in fact, the truth is that stocks do produce good returns and some stocks produce staggering returns.
If you separate companies by market cap (which any sane investor would do) you find that the majority of large cap stocks have outperformed cash.
To demonstrate this, I ran some analysis on stocks belonging to the most popular market weighted indexes and compared their CAGR return and total return to that of Treasury bills.
Controlling For Size
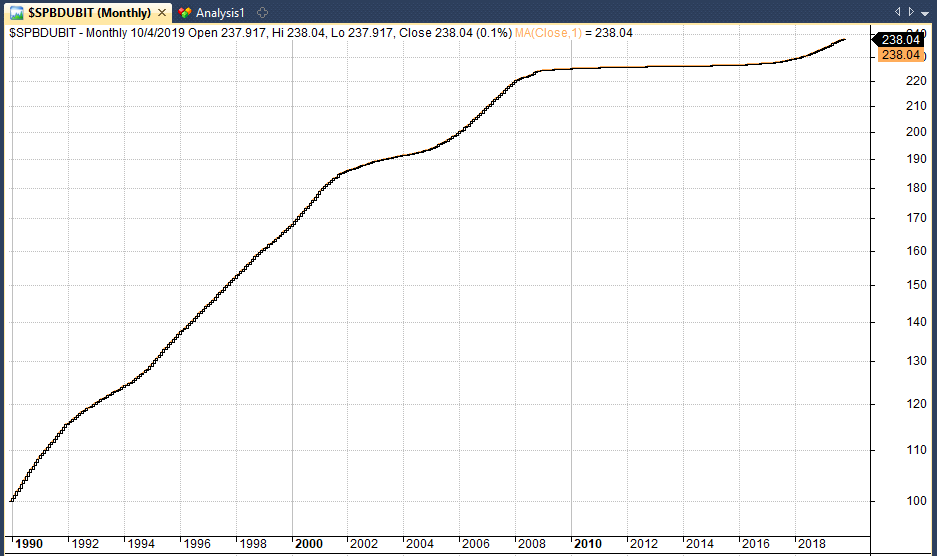
To measure the return of Treasury bills I used the S&P US Treasury Total Return Index. I calculated a total return of 133.37% between 1990 – 2019 for a compounded annual growth rate of ~2.98%:
We can now compare these figures with the returns for stocks.
The following table shows the average return for stocks by market index and the percentage that were able to beat the Treasury bill CAGR of 2.98%:
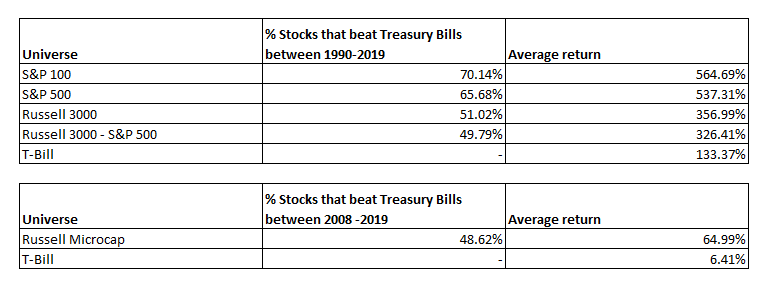
As you can see from the table above, when comparing stocks by market cap we get a very different result to that quoted in the previously mentioned study.
Specifically, we found that 70.14% of S&P 100 stocks and 65.68% of S&P 500 stocks produced a better CAGR than Treasury bills between 1990 and 2019.
This is much better than the quoted statistic that only 44% of US stocks outperformed T-bills.
We also found that 51.02% of Russell 3000 stocks beat Treasury bills, however, that drops to 49.79% when you take away S&P 500 stocks from that list.
Our microcap data only goes back to 2008 but you can see that 48.62% of micro caps produced a better CAGR that Treasury bills between 2008 – 2019.
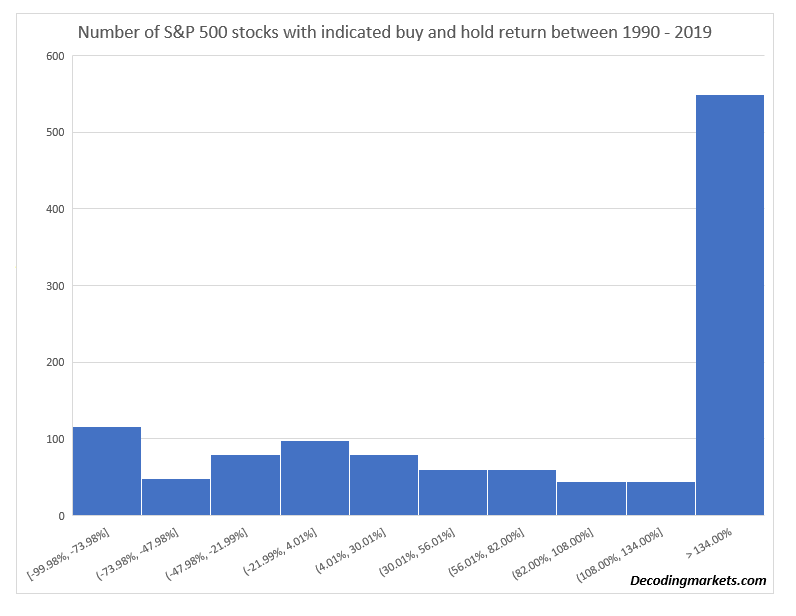
The following charts show some more analysis. You can see that between 1990 and 2019, 776 S&P 500 stocks had a CAGR over 2.9%:

Furthermore, you can see that 549 S&P 500 stocks had a total return over 134% during the same period:
So it’s clear. When you control for size, you find that the majority of large cap stocks do much better than cash. This makes total sense. The universe is back in alignment.
By the way, if you are wondering how there can be more than 500 stocks shown by these charts it’s because the S&P 500 is not a static universe.
It changes every year with new additions coming in and other stocks going out. According to our data source, there have been 1177 different members of the S&P 500 between 1990 and 2019.
Final Thoughts
It’s great to be able to read interesting research like this about the stock market.
The problem is some new investors will be put off entering the stock market if they only read the headline story.
In this case, the headline story is that most stocks do worse than Treasury bills. The reality is that the majority of large cap stocks did significantly better than Treasury bills.
The stock market is made up of thousands of small caps, micro caps and nano caps so it’s not a good idea to treat them all the same.
While some micro caps produce good returns there are also a lot of trash.
Any sensible investor knows that you cannot compare a $100 billion conglomerate with a $50 million biotech. The former could pay a dividend larger than T-bills and the latter could go bankrupt within a year.
It makes no sense to compare returns like this when the majority of listed stocks are micro caps.
Larger companies tend to produce safer returns and when you control for these effects you find that the number of stocks producing cash beating returns goes up substantially.
Any sensible investor knows this and that is why most of them put their money into large stocks. Smaller cap stocks are more risky and always will be.
Analysis in this article produced with Amibroker and Excel with historical data from Norgate Data Platinum.