

It’s that time of year again where we look back and review our trades and trading strategies from the past year.
2020 was without doubt an interesting one. The coronavirus pandemic brought chaos to people all over the world as well as to financial markets.
Few could have predicted the sharp twists and turns that markets exhibited over the last 12 months. That said, our process did not change all that much in 2020. We continued to develop new trading strategies and execute our ideas.
Before reviewing the results on this page, please note that all strategy results are based on hypothetical backtest results and performance may differ from live trading results due to slippage, market impact and other factors. Past performance is also not a reliable indicator of future performance.
Unless specified otherwise, simulations include commissions of $0.01 per share and data is adjusted for capital actions, survivorship-bias and dividends. Leverage is generally not used and our benchmark will be the S&P 500 index which returned 15.6% in 2020.
Daily systems are backtested with data from Norgate and intraday systems use data from eSignal. Strategies are backtested in Amibroker and shown in no particular order.
If you are interested in last year’s performance numbers please see Performance Of Our Trading Systems In 2019.
1. Simple MA Crossover
This is one of my first ever trading strategies that I created back in 2012. It’s a basic trend following strategy that selects stocks on the weekly chart.
The truth is, it’s not an amazing trading system but it has been profitable historically. However, it had a lacklustre year in 2020 and produced a negative return:
- # Trades 31
- Return: -8.9%
- MDD: -40.13%
- CAR/MDD: -0.22
- RAR: -9.28%
- Win Rate: 54.84%
- Profit Factor: 0.78
- Published: May 2015
2. Cherry Picking Stocks
This is another one of my very early ones that is also a trend following strategy. This one goes long and short stocks from the S&P 1500 universe and was first published in January 2016. It made money in 2019 but it made a loss here:
- # Trades: 30
- Return: -10.97%
- MDD: -13.58%
- CAR/MDD: -0.81
- RAR: -11.11%
- Win Rate: 33.33%
- Profit Factor: 0.59
- Published: January 2016
3. Overnight Reversal
This strategy is based on an academic paper I came across several years ago. The system trades near to the close and holds trades overnight. It had a standout year in 2020 with strong risk-adjusted returns of over 700%. However, there is some difficulty in executing this strategy which is why I don’t trade it myself. After this year, I might give it another look:
- # Trades: 90
- Return: 55.33%
- MDD: -22.94%
- CAR/MDD: 2.44
- RAR: 720.33%
- Win Rate: 67.78%
- Profit Factor: 1.93
- Published: October 2016
4. Trading The Gap
Trading The Gap has a good historical performance but performance has suffered the last few years. This is also another difficult system to execute and typically requires an automated program.
- # Trades: 242
- Return: -26.85%
- MDD: -32.02%
- CAR/MDD: -0.84
- RAR: -137.4%
- Win Rate: 51.24%
- Profit Factor: 0.72
- Published: Oct 2016
5. Bar Strength
Bar Strength is a daily mean reversion strategy that takes positions in a selection of 7 highly liquid ETFs. This system has been a consistent performer since we published it and it had another good year in 2020:
- # Trades: 117
- Return: 21.72%
- MDD: -12.5%
- CAR/MDD: 1.74
- RAR: 49.03%
- Win Rate: 64.1%
- Profit Factor: 1.91
- Published: May 2017
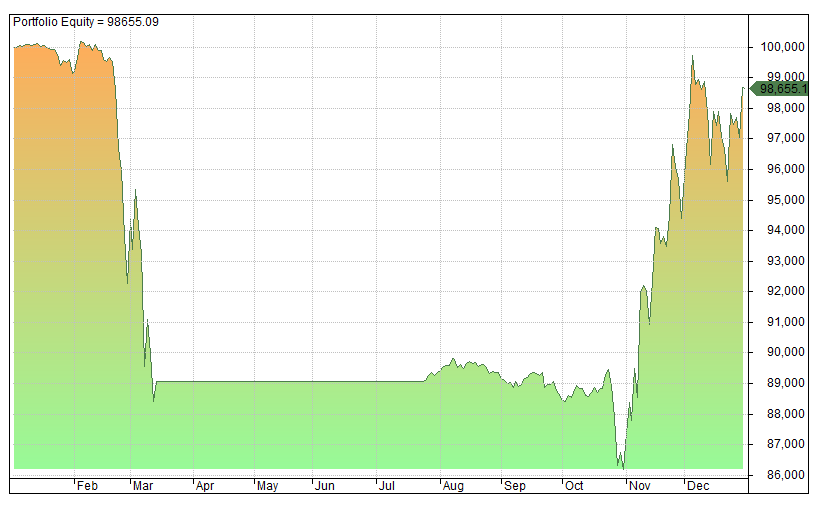
6. Shorting Supernovas
This system takes short positions in fast moving, momentum stocks and has performed well in our historical simulations. It had an excellent year in 2020 recording a return of 84.55%. There is some overnight risk to this system which it has so far avoided. Because of this it is only for experienced traders and needs to be monitored closely.
- # Trades: 133
- Return: 84.55%
- MDD: -16.36%
- CAR/MDD: 5.19
- RAR: 354.86%
- Win Rate: 58.65
- Profit Factor: 1.61
- Published: October 2016
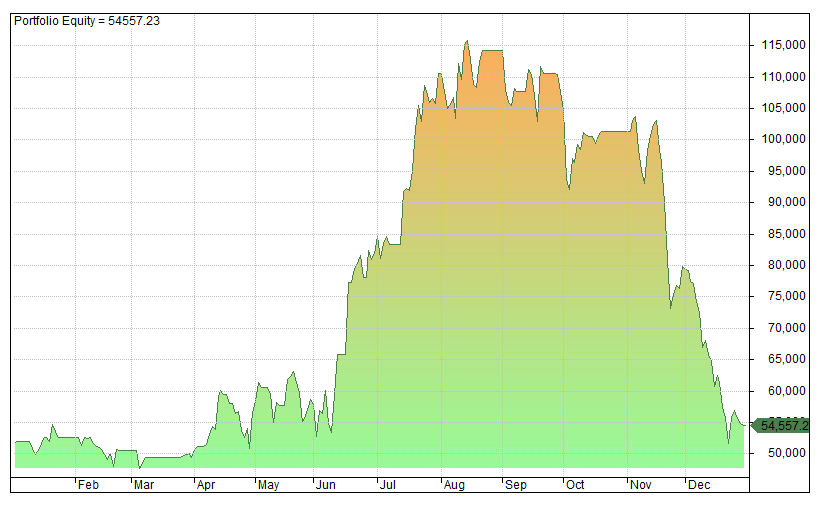
7. Unusual Volume
This system looks for stocks on a weekly chart showing unusual volume patterns. The logic behind this system seems decent enough but it has been a consistent poor performer since publication:
- # Trades: 292
- Return: -25.33%
- MDD: -26.59%
- CAR/MDD: -0.96
- RAR: -47.52%
- Win Rate: 42.26%
- Profit Factor: 0.66
- Published: Oct 2016
8. Trend Pilot
This investing strategy is based on the same concept as the Pacer Trendpilot ETF which uses simple technical rules to stay on board upward trends. We use a walk-forward process to reoptimise the parameters every year. This resulted in only one trade in 2020 but it was a good one. It might be a good concept to apply to other securities:
- # Trades: 1
- Return: 25.12%
- MDD: -9.42%
- CAR/MDD: 2.67
- RAR: 42.3%
- Win Rate: 100%
- Profit Factor: NA
- Published: April 2017
9. Mid Cap Winners
This system combines simple technical rules to pick swing trades from the mid cap space. The strategy has done well in the past but it took a beating in the March crash and was slow to recover:
- # Trades: 78
- Return: -7.47%
- MDD: -39.05%
- CAR/MDD: -0.19
- RAR: -9.97%
- Win Rate: 43.59%
- Profit Factor: 0.85
- Published: August 2017
10. Follow The Money
Follow The Money selects trending stocks from the S&P Small Cap 600 Universe. This has historically been one of my prefferred trading strategies and I still use it today (with some added discretion). It took a dive in February and March but has made a recovery since.
- # Trades: 88
- Return: 6.04%
- MDD: -22.79%
- CAR/MDD: 0.27
- RAR: 7.56%
- Win Rate: 46.59%
- Profit Factor: 1.18
- Published: May 2017
11. Nasdaq Pivots
Nasdaq Pivots is a day trading, long only strategy that uses pivot levels. This is another system that trades a lot and benefits from fast execution. It didn’t have an incredible year in 2020 although risk-adjusted return is OK:
- # Trades: 330
- Return: 6.45%
- MDD: -8.66%
- CAR/MDD: 0.75
- RAR: 19.91%
- Win Rate: 56.06%
- Profit Factor: 1.09
- Published: May 2017
12. ETF Pullbacks
ETF Pullbacks was adapted from a well known strategy first developed by Larry Connors. Essentially, it is a buy the dip system for equity ETFs. It has not performed that well since publication and it trailed the market this year:
- # Trades: 64
- Return: -9.5%
- MDD: -29.13%
- CAR/MDD: -0.33
- RAR: -63.75%
- Win Rate: 73.44%
- Profit Factor: 0.64
- Published: June 2017
13. Shorting ETFs
This system attempts to short highly volatile leveraged ETFs. It therefore has a high risk profile. It is also quite difficult to model accurately due to short selling requirements. It had a fairly good year in 2020 with a 13% total return and win rate of 79%. It did give back some of its gains at the end of the year:
- # Trades: 14
- Return: 13.03%
- MDD: -14.96%
- CAR/MDD: 0.87
- RAR: 117.97%
- Win Rate: 78.57%
- Profit Factor: 1.50
- Published: May 2017
14. Money Flow v1
This is a daily mean reversion strategy based on simple price rules. The system made a loss in 2019 but it produced a good return here when adjusting for risk. Risk-adjusted return on SPY and TLT was 76% with a win rate of 82%. Perhaps this system could be traded with options or leverage.
- # Trades: 11
- Return: 4.71%
- MDD: -2.82%
- CAR/MDD: 1.68
- RAR: 75.52%
- Win Rate: 81.82%
- Profit Factor: 2.33
- Published: December 2017
15. Money Flow v2
We also publish a leveraged version of Money Flow that trades ETFs TMF and TNA. The system did well in 2019 but it was a net loser in 2020:
- # Trades: 11
- Return: -17.88%
- MDD: -28.46%
- CAR/MDD: -0.63
- RAR: -262.95%
- Win Rate: 63.64%
- Profit Factor: 0.46
- Published: December 2017
16. Nuggets Of Gold
This strategy was developed using a data mining approach with Build Alpha software. It was first developed on the GDX ETF and later applied to the NUGT Gold Miners ETF. However, the performance has been consistently poor since it was published which makes me suspect it was over-optimised.
- # Trades: 65
- Return: -35.04%
- MDD: -56.74%
- CAR/MDD: -0.62
- RAR: -114.27%
- Win Rate: 55.38%
- Profit Factor: 0.69
- Published: December 2017
17. Jesse Livermore System
This trading strategy is based on rules described in the classic investment book Reminiscences Of A Stock Operator. It made money in 2019 and has become one of my preferred systems. So it was good to see the strategy put in another decent performance in 2020.
- # Trades: 39
- Return: 27.7%
- MDD: -28.14%
- CAR/MDD: 0.99
- RAR: 33.53%
- Win Rate: 46.15%
- Profit Factor: 2.04
- Published: May 2019
18. VIX Trio
This strategy trades a watchlist of 3 popular ETFs; SPY, TLT and GLD and was inspired by the work of Dr. Howard Bandy. It has produced good results since publication with an astounding win rate and profit factor:
- # Trades: 12
- Return: 10.02%
- MDD: -17.48%
- CAR/MDD: 0.57
- RAR: 17.5%
- Win Rate: 91.67%
- Profit Factor: 7.13
- Published: January 2018
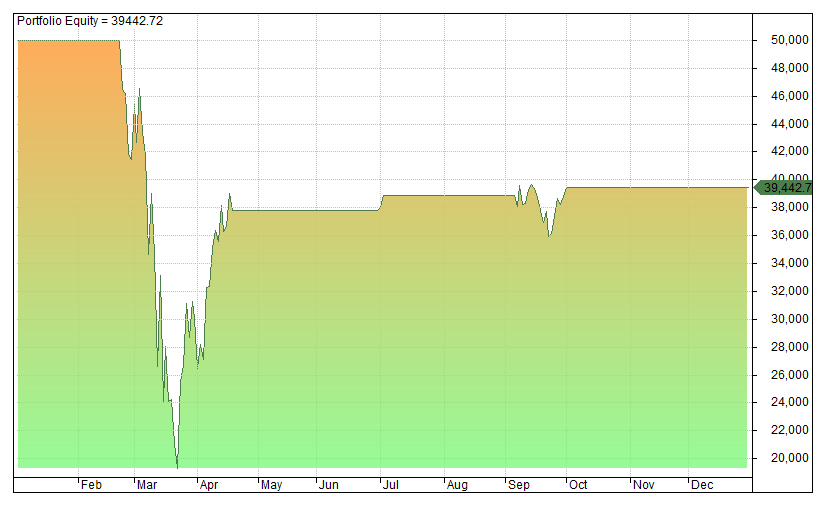
19. Trading For Yield
Trading For Yield has been one of our best performing trading strategies over the years but the buck stopped in 2020 when coronavirus hit. Many companies cut dividends and corporate bonds plummeted which was bad news for this system which trades high yield ETFs.
- # Trades: 35
- Return: -24.52%
- MDD: -54.7%
- CAR/MDD: -0.45
- RAR: -66.2%
- Win Rate: 71.43%
- Profit Factor: 0.53
- Published: July 2017
20. Second Time Lucky
This is a daily, mean reversion strategy that trades stocks from the S&P 500 universe. It has been a good performer out-of-sample but it only broke even in 2020:
- # Trades: 43
- Return: 0.1%
- MDD: -6.94%
- CAR/MDD: 0.01
- RAR: 1.1%
- Win Rate: 41.86%
- Profit Factor: 1.01
- Published: April 2018
21. Micro Longs
Micro Longs is a daily, trend following system that trades micro cap stocks. This strategy made 15% in 2019 and it had an even better year in 2020; hitting a 33% total return and 74% risk-adjusted return:
- # Trades: 85
- Return: 33.22%
- MDD: -22.86%
- CAR/MDD: 1.46
- RAR: 73.93%
- Win Rate: 43.53%
- Profit Factor: 1.61
- Published: June 2018
22. Micro Shorts
This is a higher risk system for shorting Russell Micro Cap stocks. It did poorly in 2019 but produced a 9.11% return in 2020. Looking at the stats below you can see it trades quite frequently. There is plenty of scope for improvement to be more selective with trade signals. Doing so might have prevented the sharp slide at the end of the year:
- # Trades: 352
- Return: 9.11%
- MDD: -55.35%
- CAR/MDD: 0.17
- RAR: 22.49%
- Win Rate: 59.94%
- Profit Factor: 1.01
- Published: May 2018
23. Perfect Pullbacks
Perfect Pullbacks were not so perfect in 2020. The system only entered 3 trades and one was a big loser right before the pandemic hit.
- # Trades: 3
- Return: -21.11%
- MDD: -61.46%
- CAR/MDD: -0.34
- RAR: -96.15%
- Win Rate: 66.67%
- Profit Factor: 0.14
- Published: July 2018
24. Triple Bottom Stocks
This system trades triple bottom chart formations from the S&P 500 universe of companies and trades on a weekly timeframe. I was surprised to see that this system found no triple bottom patterns in 2020 and thus no trade signals:
- N/A
25. 5-Rule Momentum
This is a daily momentum strategy we developed based on 5 simple rules. Plenty of trend following/momentum systems did well last year so I was surpised to see that this system did poorly. It was out of the market for too long after the crash which prevented it from making a recovery.
- # Trades: 34
- Return: -1.34%
- MDD: -13.99%
- CAR/MDD: -0.1
- RAR: -6.09%
- Win Rate: 50%
- Profit Factor: 0.89
- Published: June 2019
26. Sector Stragglers
Sector Stragglers is one of my preferred strategies and it continued to perform well in 2020. I had to make some changes to the code on this one since something was not quite right in the mapping of sectors to symbols. The system now looks at industry instead of sector but performance was good for both versions:
- # Trades: 472
- Return: 30.03%
- MDD: -12.44%
- CAR/MDD: 2.43
- RAR: 34.11%
- Win Rate: 58.26%
- Profit Factor: 1.35
- Published: August 2018
27. Trading By The Book
Trading By The Book is a mean reversion system for US stocks that incorporates price-to-book fundamental data. Unfortunately, I am not currently subscribed to the data so I am unable to provide an accurate update on the system at this time. I hope to look at this one at a later date.
28. Volatility Trader
This strategy trades VXX and SVXY in a short-term trend following approach. We used synthetic VXX data in order to backtest the strategy further back past the inception date of the ETF. However, this system was mediocre in 2020 and I don’t have much confidence in it:
- # Trades: 37
- Return: 3.57%
- MDD: -18.83%
- CAR/MDD: 0.19
- RAR: 14.69%
- Win Rate: 59.46%
- Profit Factor: 1.06
- Published: September 2018
29. VWAP Pilot
VWAP Pilot uses a technical indicator called the volume weighted average price to find trends on intraday 30-minute charts. The system trades from a selection of randomly selected Nasdaq stocks and did ok in 2020. I think performance could be improved by being more discerning about the symbols with which to trade this system:
- # Trades: 439
- Return: 17.46%
- MDD: -20.08%
- CAR/MDD: 0.87
- RAR: 22.6%
- Win Rate: 44.87%
- Profit Factor: 1.14
- Published: February 2018
30. 60-Minute Gaps
60-Minute Gaps is an incredibly simple intraday system that we published in February 2019 and continues to show strong performance in the out-of-sample. Results shown here are with commissions of $0.005 per share and margin of 2:1:
- # Trades: 200
- Return: 22.38%
- MDD: -9.74%
- CAR/MDD: 2.30
- RAR: 49.44%
- Win Rate: 30.50%
- Profit Factor: 1.17
- Published: February 2019
31. Morning Trend
This is another intraday trading system that is applied to the 1-hour timeframe and backtested on SPY and TLT. I like the logic behind this system and it produced decent risk-adjusted returns in 2020 with margin of 2:1:
- # Trades: 210
- Return: 6.81%
- MDD: -4.57%
- CAR/MDD: 1.50
- RAR: 29.61%
- Win Rate: 54.29%
- Profit Factor: 1.17
- Published: April 2019
32. IPO Effect
IPO Effect is not a complete trading system but a study on the performance of recent IPOs on their first day of trading. In 2020 I counted 184 IPOs and SPACs on the Nasdaq with a first day turnover greater than $1 million. The average first day profit was 1.24% with a 45% win rate. The risk-adjusted return was 348.75% which suggests a profitable strategy could have been devised.
- # Trades: 184
- Expectancy: 1.24%
- Return-to-risk: 1.03
- RAR: 348.75%
- Win Rate: 45.11%
- Profit Factor: 1.25
- Published: September 2019
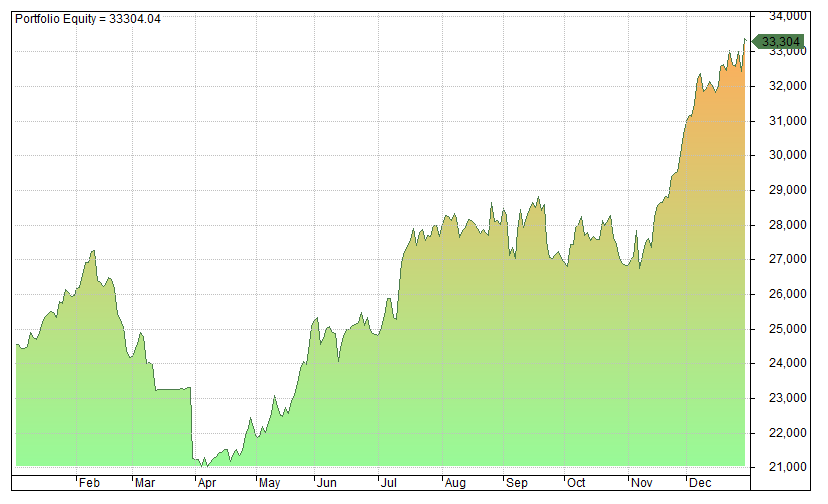
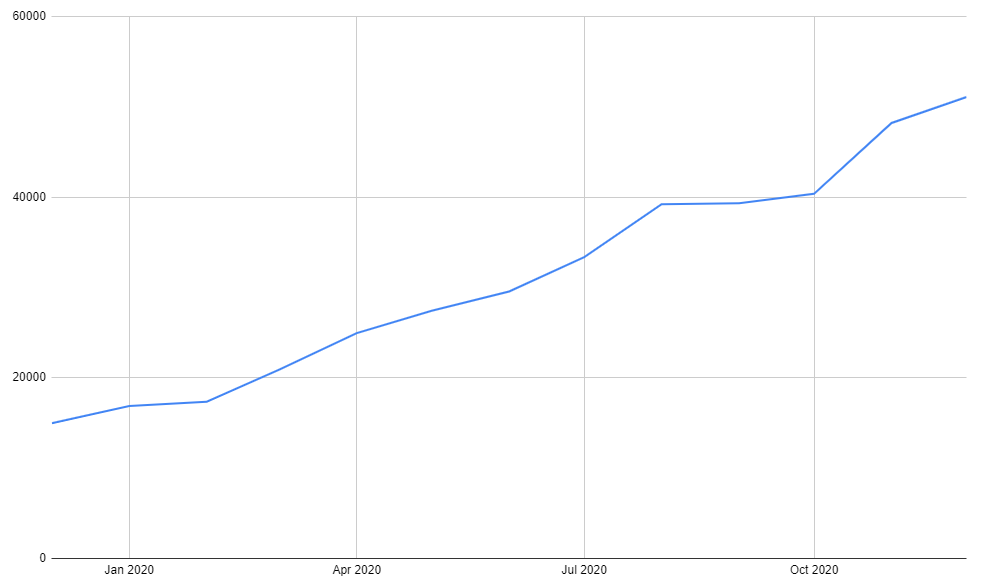
33. Zero To One Million
ZTM is our monthly investing strategy that combines a systematic, dollar cost averaging strategy with human discretion. The idea is to buy 1-3 quality stocks each month and compound returns over the long term.
This approach produced a return of 16% in 2019 and went one better in 2020 with a 29.3% annual return. By comparison, investing regular amounts in the S&P 500 in 2020 would have produced only 12.55%.
- Positions: 48
- Return: 29.32%
- MDD: -34.1%
- CAR/MDD: 0.85
- Start Date: February 2019
Missing Systems
The following systems are missing from this list because they were published in 2020 so we don’t have enough data yet to publish informative results:
- IV Rotation – Published June 2020
- Classic Trend Following – Published September 2020
- Profitable Stocks – Published November 2020
- Large Cap Timing – Published December 2020
Start Date Bias
One thing to bear in mind when reviewing these results is that statistics can differ substantially depending on when the backtest is started.
For example, when we backtest the Follow The Money Strategy starting on January 2020 we get a return of 6.04%. But when we start the backtest on the date of publication (May 2017), the 2020 return is recorded as 9.7%.
This issue swings both ways and is more of a problem with the longer term strategies which have a slower turnover of new positions. There is not much you can do about this problem other than to backtest a wider range of start dates. It’s something to think about when reviewing the results.
My Trading Account
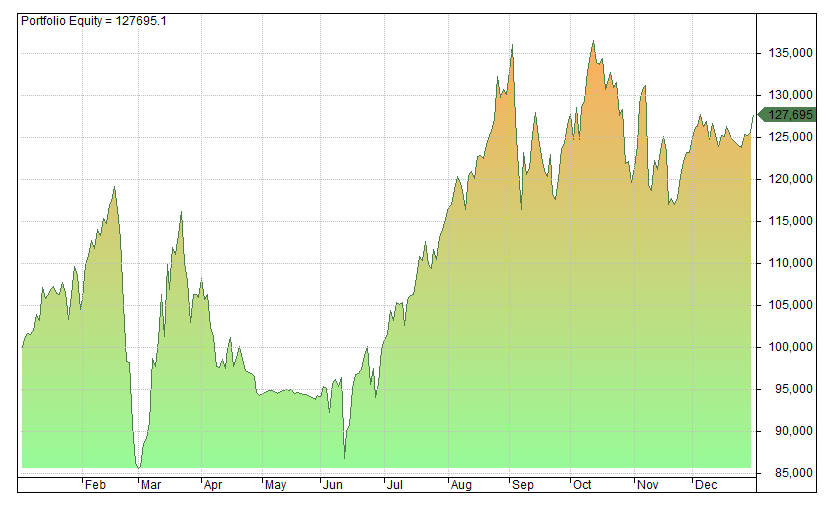
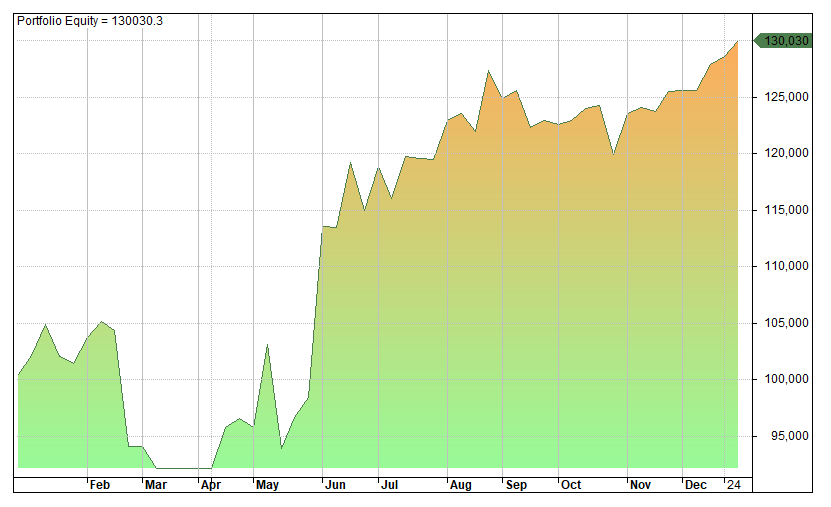
In addition to the above backtest results I am happy to publish my own real trading results from my short-term trading account.
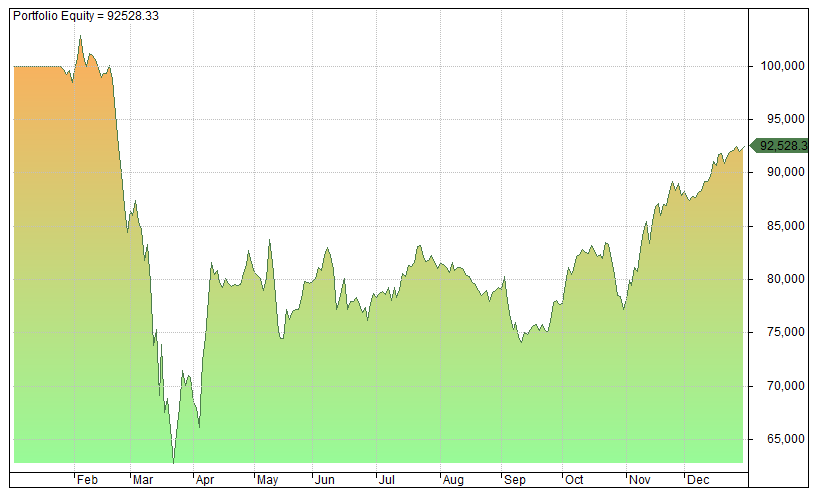
My personal style is to combine systematic trading signals with human discretion. Using this approach, my short-term trading account produced a real total return of 36.75% in 2020 with a drawdown of 61% and a win rate of 53%.
I thought my return would have been higher than this but I made some mistakes that cost me a significant chunk of gains. Nearly all of my losses came from discretionary short trades which I rationalised as being hedges for my long positions.
- Trades: 47
- Return: 36.75%
- Max Drawdown: -61.01%
- Win Rate: 53%
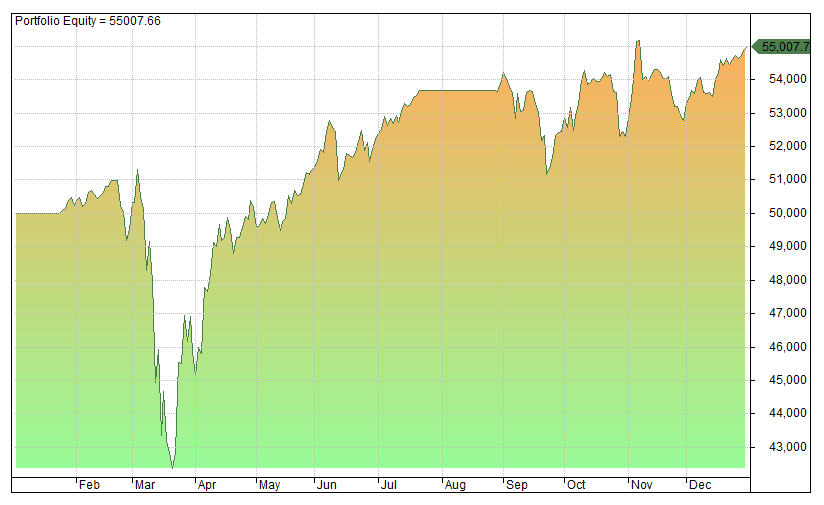
My Investing Account
In addition to my short-term trading account I have a long-term portfolio which I am slowly giving more focus too.
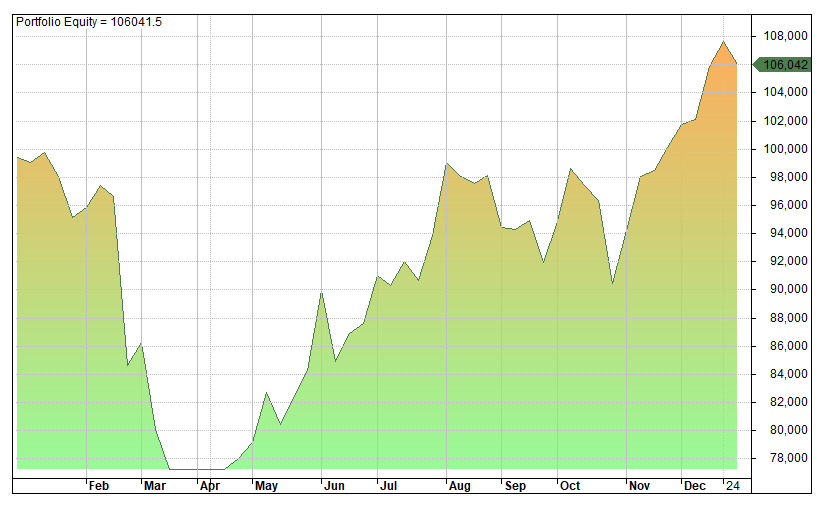
My long-term approach to investing mimics the Zero To One Million strategy that I describe above. The real performance of my long-term portfolio in 2020 was therefore the same as shown earlier, 29.3% total return with a drawdown of -34.1%.
Although this may not seem like a huge return, I feel this is a good result for this style of investing (monthly dollar cost averaging) which is more than double the benchmark. This type of investing approach is never going to make massive returns as it involves slowly building up long term holdings, not market timing.
- Total Holdings: 48
- Return: 29.32%
- MDD: -34.1%
- CAR/MDD: 0.85
Round-Up
This is a quick round-up of some of the trading strategies that I have published on Marwood Research. I have also included results from my own accounts.
Some trading strategies are not included here because we either don’t have enough data yet or they cannot be backtested.
For example, Daily Options Income, the Big Volatility Short and Trading Google Trends have too many moving parts to be backtested accurately.
Overall, I am relatively pleased with the performance of our trading strategies in 2020.
61% of our strategies produced a positive return in 2020 and a third beat the benchmark return from the S&P 500.
It should also be noted that these systems are far from optimal and most use no leverage. Improvements can be made to position sizing and through combining the systems together.
Plus, I always say that the systems are not intended to be followed directly. They are examples/templates that can be used as a base to build on or explore different techniques and discretionary ideas.
Experienced traders will use these examples as starting points for their own trading systems and ideas.
Final Thoughts
2020 was a crazy year with many ups and downs in the markets. Some traders went bust while others made a killing. As usual, it is the big winners that we tend to hear about and not those who did poorly.
Looking at the performance statistics from some investors it is easy to feel some dissappointment if you did not have similar success. Indeed, when I calculated the mark-to-market return for my short-term account I was surprised to see that I had only made a 37% return.
It turns out that I had forgotten about a deposit I made earlier in the year. Combined with some poor short trades and some currency fluctuations, my return was much lower than expected.
However, it is never a good idea to compare your performance with other traders. For one thing, you don’t know what risk they took to get those numbers or their performance prior.
The truth is I am happy with the progress I made in 2020, both in trade selection and system development. I made some mistakes but I’m not sure I could have done any better, particularly given the significant time constraints I had this year brought on by the pandemic.
I am also satisfied with the return from my longer term account which was more than double my benchmark and is coming along nicely. This is a simple strategy that is robust and fully explained for those who want to take a similar approach.
Furthermore, I’m excited because I have a number of great investing ideas for 2021 and looking forward to making more progress as well as sharing some of those ideas here.
Thanks for sharing! May I ask which systems you trade in your own trading account? Also I would like to suggest the backtesting platform QuantConnect if you are interested in backtesting other asset classes and/or shorter timeframes. (They even have intraday bid-ask data for free on stocks, options, futures and cryptos. Survivorship-bias free, however they do not have historical consistuents of indices like Norgate, but you can simulate it. Also, Quantpedia has implemented some of their published systems in QC).
A trading idea of my own: cash-and-carry arbitrage by going long bitcoin and shorting bitcoin futures. The roll yield now is 19% for the March futures (https://analytics.skew.com/dashboard/okex-bitcoin, 3rd row, 2nd column). I do not really understand why this is so large, because it costs nothing to hold bitcoin itself.
(the 19% is annualized)
I like to focus on a couple of strategies that I like best. Yes I am well aware of QuantConnect and Quantpedia. QC is a great platform.
You show 33 trading systems and mention 4 others that you did not show for 2020 for various reasons. What is your daily/weekly/monthly process? Do you sit down and run all of the systems ending up with 20 to 50 stocks/ETFs to evaluate and then do your research on the 25 to 50 stocks? After the research you pick a few in which to actually invest.
Do you have any systems that you trust enough to let it trade live without human intervention?
I have two systems that I focus on. They are both end of day swing systems. I spend 10 – 20 minutes each night going over trades for the next day open.