
One of the main reasons why I started Marwood Research is so I have a place to store all of my trading systems.
Uploading them online means I can now look back and see how they have performed since they were published.
Being able to evaluate the systems on new, unseen data is really important because when we test systems on historical data it is very easy to introduce curve fitting.
Now that 2019 is in the books it’s time to take a look at how our trading strategies performed last year. That’s what we will do in this blog post.
Please note that all results on this page are based on hypothetical backtest results and backtest results may differ from live trading results due to slippage and market impact. Also, past performance is not necessarily an indicator of future performance.
Unless specified otherwise, all simulations include commissions of $0.01 per share, zero leverage and data is adjusted for capital actions, survivorship-bias and dividends.
Daily systems are backtested with data from Norgate and intraday systems use data from eSignal. Strategies are backtested in Amibroker and shown in no particular order:
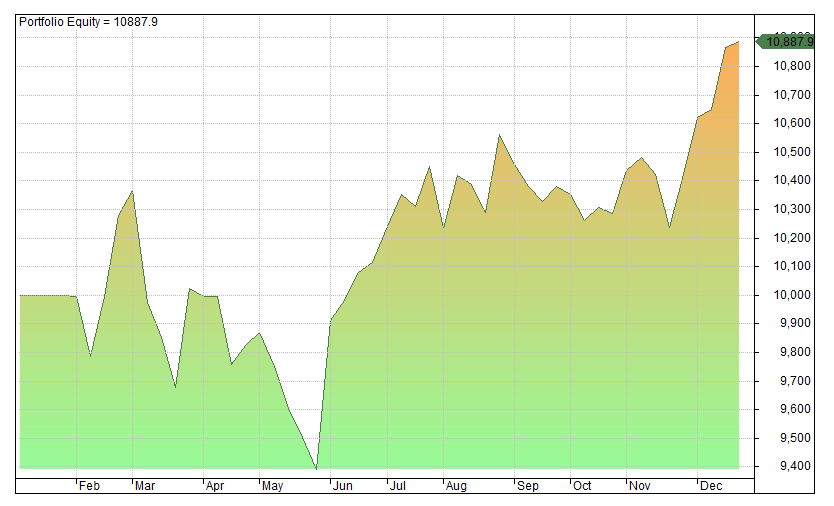
1. Simple MA Crossover
The Simple MA Crossover is a long-only, weekly, trend following strategy. This one of my first ever trading systems that I created back in 2012 and published in 2015.
It’s not a trailblazer and never will be but it does keep plodding along. In 2019 it placed 26 trades for a net profit of 8.9% and a risk-adjusted return of 10.10%.
- # Trades: 26
- Return: 8.9%
- MDD: -9.42%
- CAR/MDD: 0.96
- RAR: 10.10%
- Win Rate: 57.96%
- Profit Factor: 1.84
- Published: May 2015
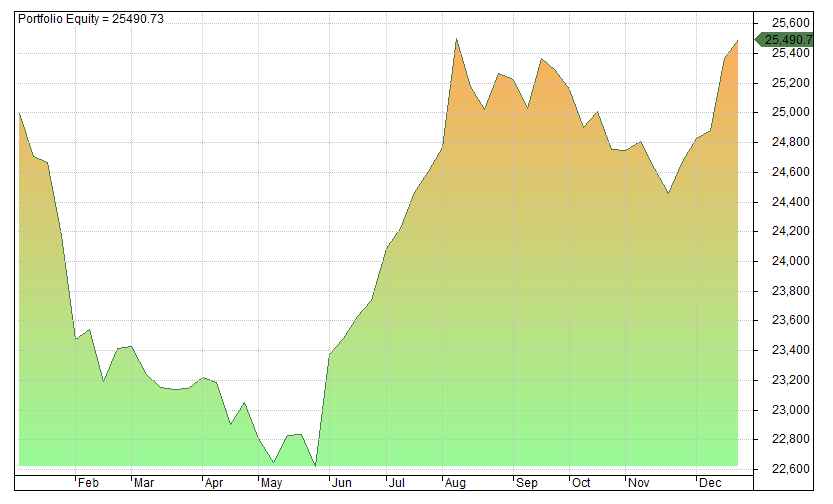
2. Cherry Picking Stocks
This is a long/short breakout strategy that picks stocks from the S&P 1500 universe. It was first published in January 2016 and had a mediocre year in 2019:
- # Trades: 25
- Return: 2%
- MDD: -9.53%
- CAR/MDD: 0.21
- RAR: 2.02%
- Win Rate: 44%
- Profit Factor: 1.15
- Published: January 2016
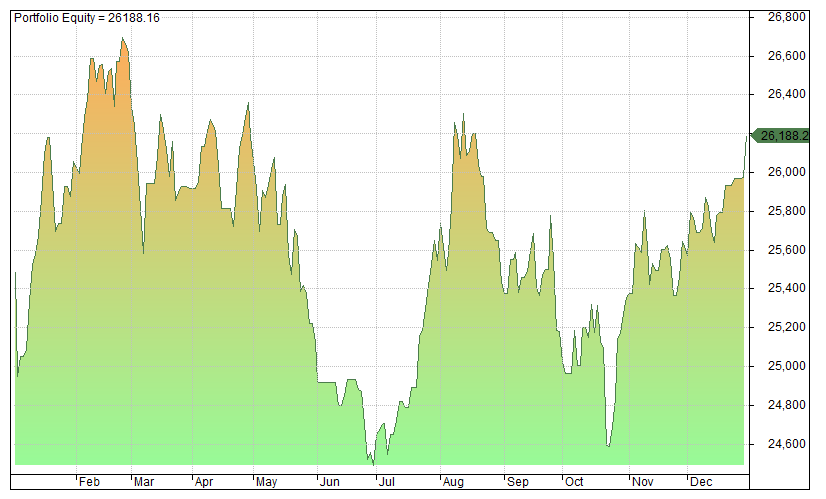
3. Nasdaq Pivots
Nasdaq pivots is a day trading strategy that was first published in May 2017. The system requires fast execution and preferably requires an automated program to trade it effectively.
- # Trades: 352
- Return: 2.8%
- MDD: -8.27%
- CAR/MDD: 0.58
- RAR: 13.92%
- Win Rate: 53.41%
- Profit Factor: 1.09
- Published: May 2017
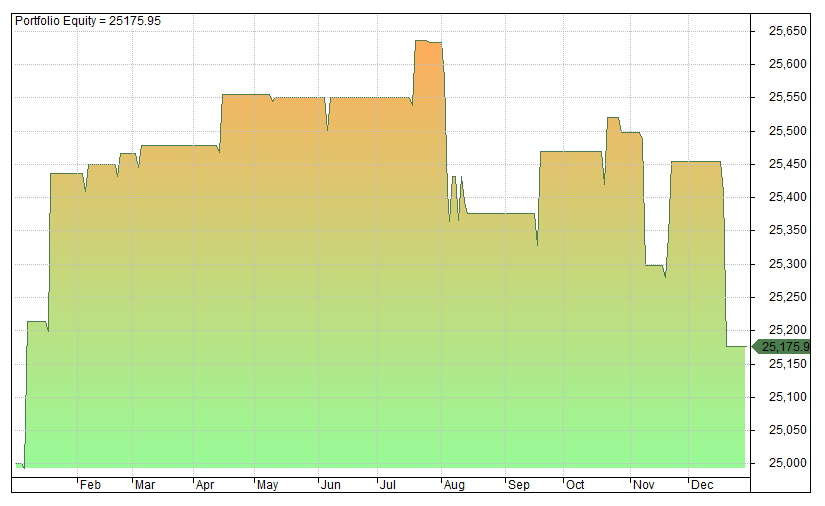
4. Overnight Reversal
Overnight reversal takes overnight positions across the S&P 1500 universe of stocks. The system is based on an academic paper and was published in October 2016:
- # Trades: 24
- Return: 0.7%
- MDD: -1.79%
- CAR/MDD: 0.39
- RAR: 28.61%
- Win Rate: 62.5%
- Profit Factor: 1.22
- Published: October 2016
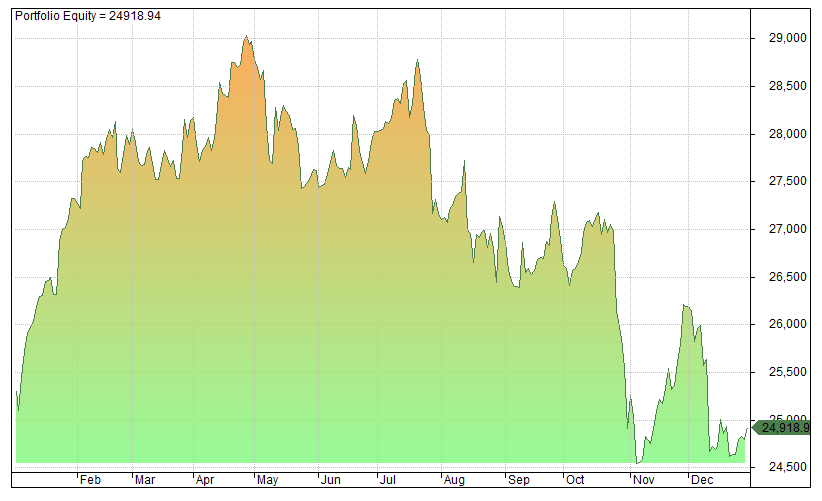
5. Trading The Gap
Trading The Gap has historically been one of our best performing strategies in the backtest. However, it typically requires an automated program and it has struggled in the last couple of years so it is not a system I have too much confidence in anymore:
- # Trades: 250
- Return: -1.5%
- MDD: -15.48%
- CAR/MDD: -0.02
- RAR: -1.65%
- Win Rate: 55.2%
- Profit Factor: 1
- Published: Oct 2016
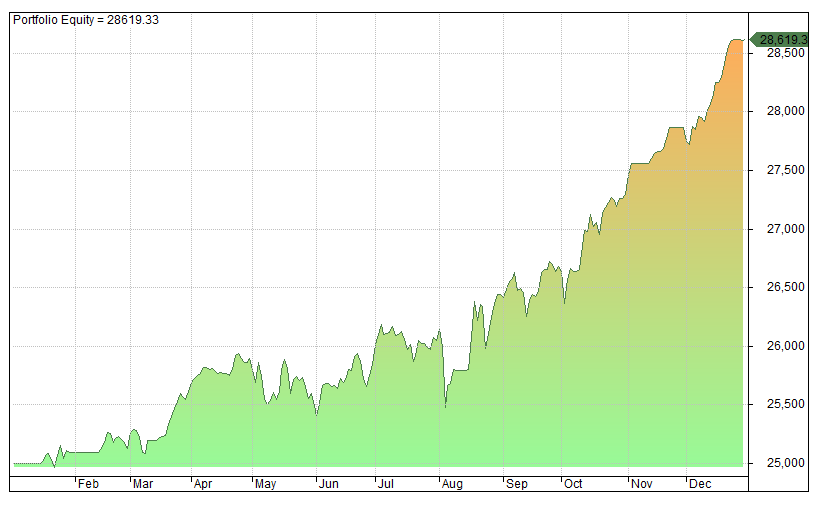
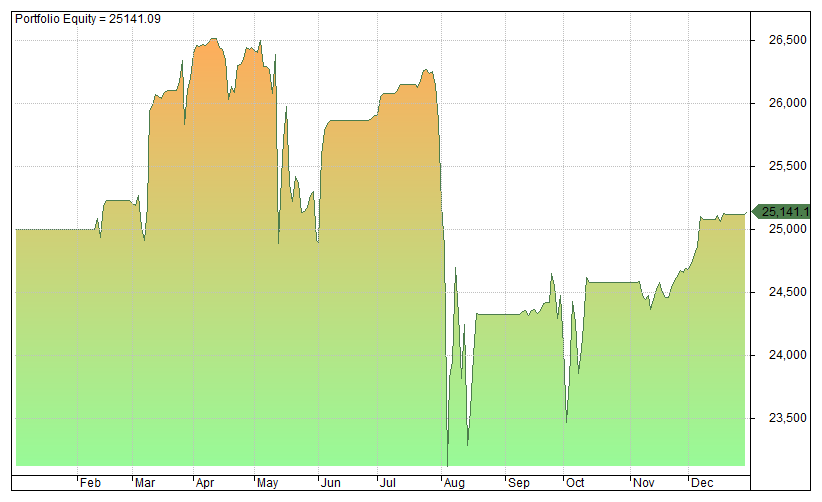
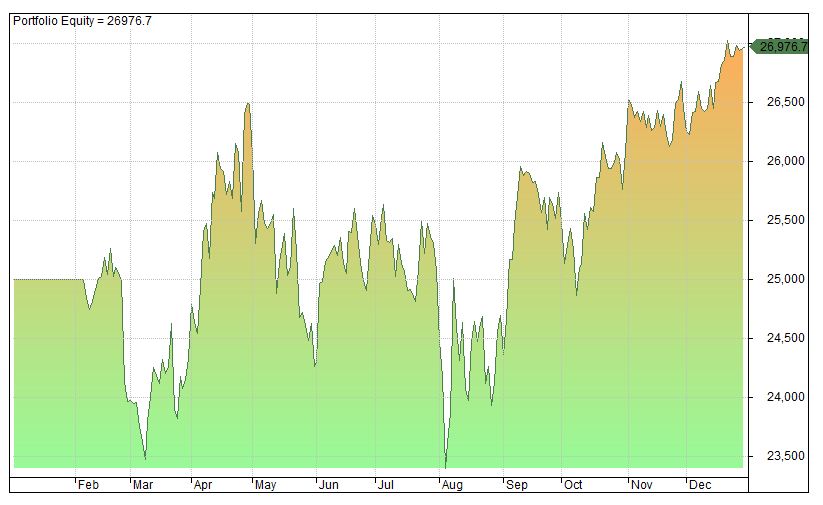
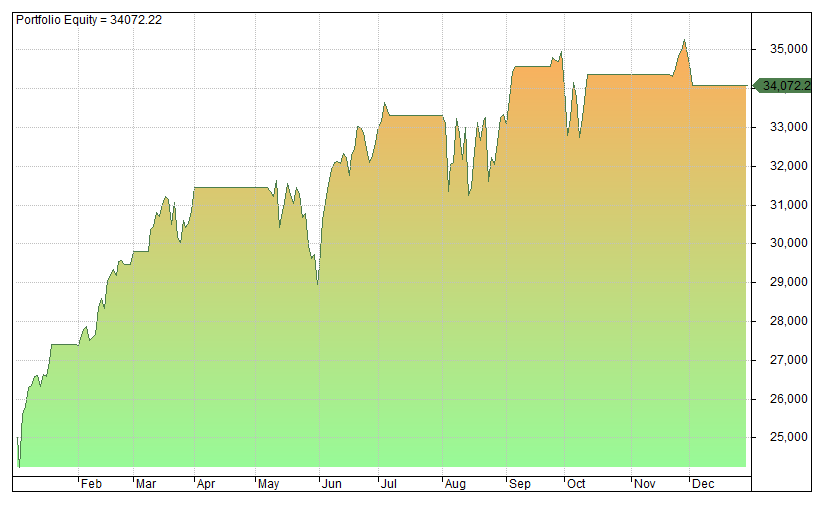
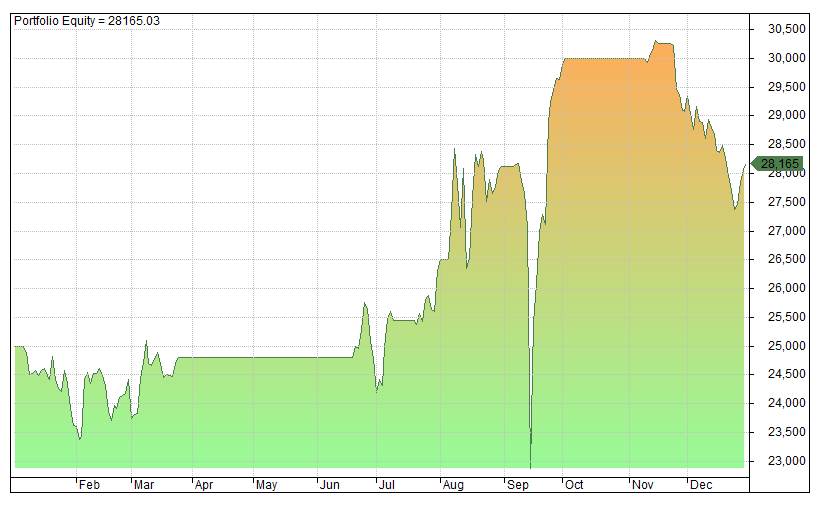
6. Bar Strength
Bar Strength trades a watchlist of 7 liquid ETFs on a daily timeframe. This has been one of our most consistent trading strategies over recent years. On our program we also show a potential enhancement with the use of alternative data.
- # Trades: 86
- Return: 14.5%
- MDD: -2.73%
- CAR/MDD: 5.33
- RAR: 34.52%
- Win Rate: 65.12%
- Profit Factor: 2.66
- Published: May 2017
7. Shorting Supernovas
Shorting Supernovas attempts to take targeted short positions in high flying stocks. It has a strong performance in historical backtests and produced a risk-adjusted return over 100% in 2019 according to our simulations. It does have a high risk profile and should be monitored at all times:
- # Trades: 63
- Return: 10.9%
- MDD: -7.98
- CAR/MDD: 1.38
- RAR: 100.29%
- Win Rate: 47.62
- Profit Factor: 1.28
- Published: October 2016
8. 5-Rule Momentum
This is a daily momentum system for S&P 500 stocks that was published in June 2019. Therefore these results only include 6-months of truly unseen data. To be honest I’m quite surprised the performance was not better:
- # Trades: 30
- Return: 5.0%
- MDD: -9.26%
- CAR/MDD: 0.54
- RAR: 7.61%
- Win Rate: 60%
- Profit Factor: 1.68
- Published: June 2019
9. ETF Pullbacks
This strategy attempts to buy the dip across a selection of 25 popular ETFs. The strategy performed poorly in 2019 and just about broke even on the year:
- # Trades: 80
- Return: 0.6%
- MDD: -12.84%
- CAR/MDD: 0.04
- RAR: 2.85%
- Win Rate: 61.25%
- Profit Factor: 1.04
- Published: June 2017
10. Unusual Volume
Unusual Volume is a weekly strategy that looks for moments of surging volume. The strategy is designed for S&P 1500 stocks but did poorly in 2019.
- # Trades: 317
- Return: -4.6%
- MDD: -12.95%
- CAR/MDD: -0.36
- RAR: -7.85%
- Win Rate: 49.21%
- Profit Factor: 0.90
- Published: Oct 2016
11. Micro Longs
This is a daily, trend following strategy for US micro cap stocks. The system did poorly in 2018 but bounced back in 2019 with a risk-adjusted return of 28.49%. Commissions are set at 0.1% per trade and no leverage or regime filter is applied:
- # Trades: 71
- Return: 14.8%
- MDD: -9.41%
- CAR/MDD: 1.54
- RAR: 28.49%
- Win Rate: 40.85%
- Profit Factor: 1.55
- Published: June 2018
12. Micro Shorts
Micro Shorts is a daily system for shorting micro cap stocks and it has a high risk profile. This system has been a strong performer in our historical backtests, however, it had a poor 2019 according to our simulations:
- # Trades: 158
- Return: -37.8%
- MDD: -48.57%
- CAR/MDD: -0.77
- RAR: -185.07%
- Win Rate: 53.16%
- Profit Factor: 0.78
- Published: May 2018
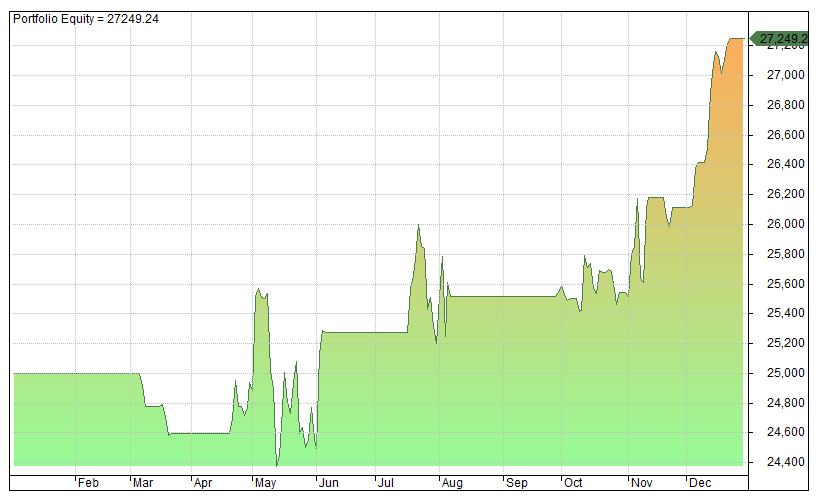
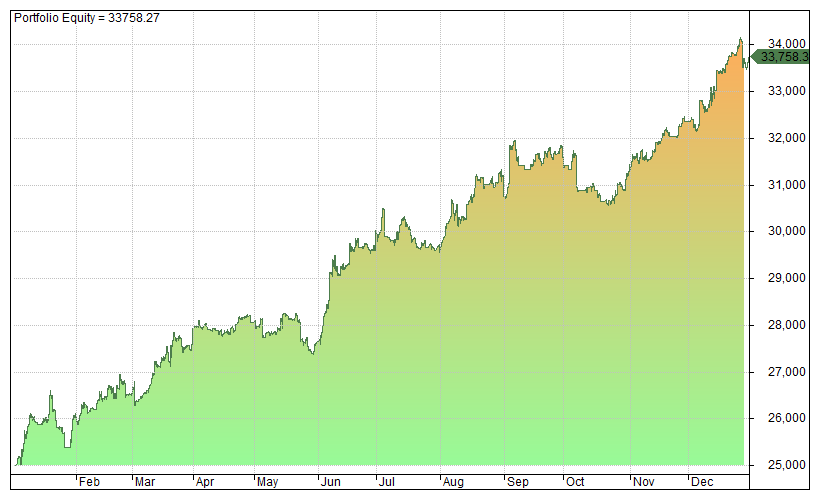
13. Mid Cap Winners
Mid Cap Winners was first published in August 2017 and has continued to hit new equity highs since publication. 2019 was another profitable year although not as strong as previous years:
- # Trades: 27
- Return: 7.9%
- MDD: -11.70%
- CAR/MDD: 0.68
- RAR: 9.95%
- Win Rate: 55.56%
- Profit Factor: 1.54
- Published: August 2017
14. Money Flow v1
Money Flow is a daily mean reversion strategy that we published in December 2017 . Here are the results in 2019 when applied to SPY and TLT:
- # Trades: 10
- Return: -1.9%
- MDD: -3.1%
- CAR/MDD: -0.61
- RAR: -37.35%
- Win Rate: 50%
- Profit Factor: 0.50
- Published: December 2017
15. Money Flow v2
Money Flow was also published with backtest results for the leveraged ETFs TMF and TNA. Here are the (much stronger) results for 2019:
- # Trades: 10
- Return: 13.8%
- MDD: -2.45%
- CAR/MDD: 5.66
- RAR: 226.08%
- Win Rate: 70%
- Profit Factor: 7.7
- Published: December 2017
16. Nuggets Of Gold
This system is a long/short daily strategy for NUGT the Gold Miners Bull 3X ETF. It can also be applied to other gold ETFs.
- # Trades: 46
- Return: 7.1%
- MDD: -24.90%
- CAR/MDD: 0.31
- RAR: 27.92%
- Win Rate: 50%
- Profit Factor: 1.11
- Published: December 2017
17. Second Time Lucky
Second Time Lucky is a daily mean reversion strategy for S&P 500 stocks that was published in April 2018. Since the maximum drawdown was very low we have included results here with 50% margin applied:
- # Trades: 42
- Return: 9.05%
- MDD: -4.69%
- CAR/MDD: 1.93
- RAR: 83.05%
- Win Rate: 61.9%
- Profit Factor: 1.84
- Published: April 2018
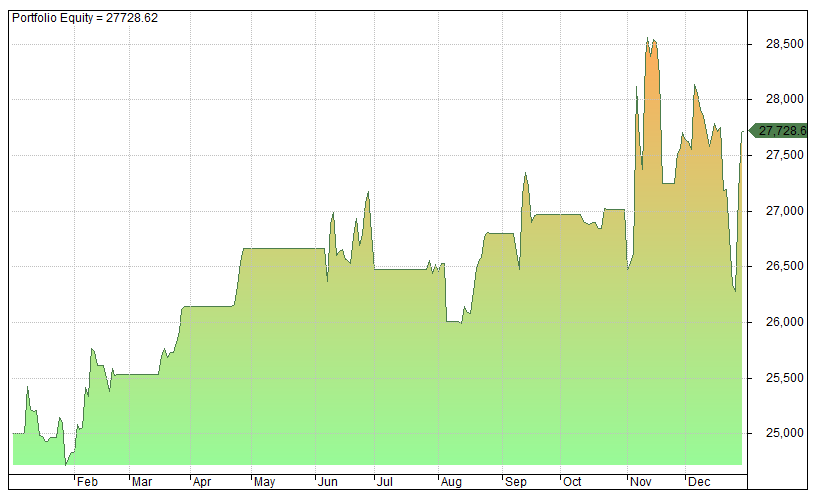
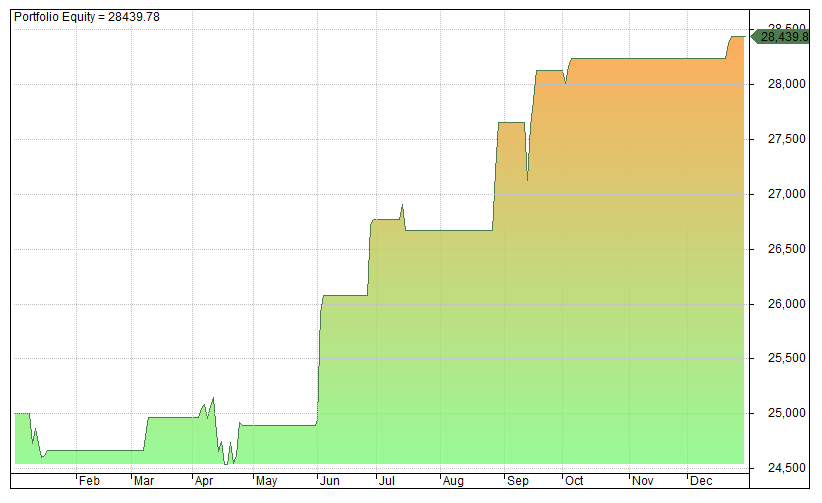
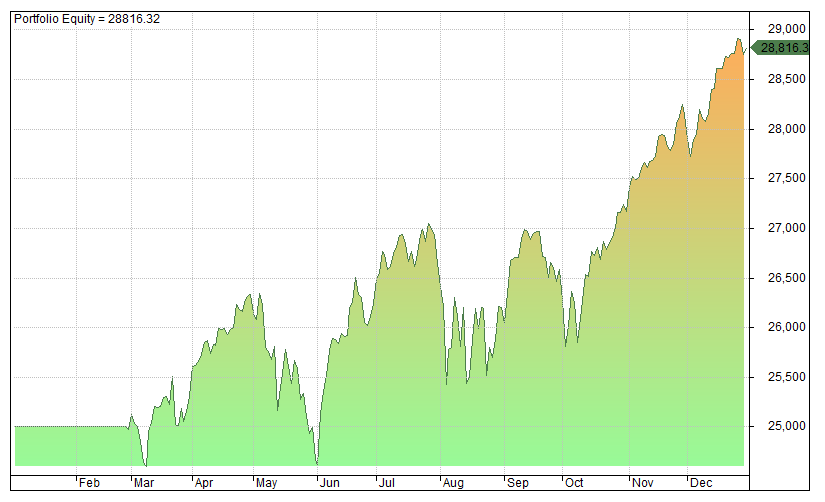
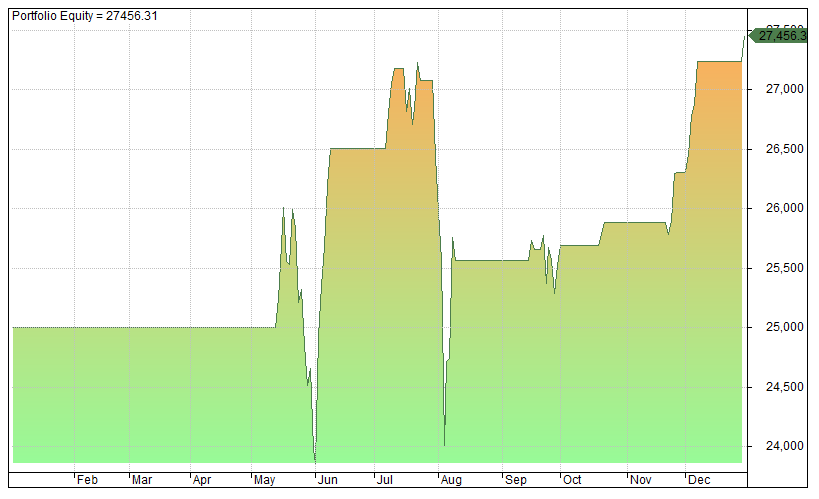
18. Sector Stragglers
This is a weekly rotation strategy that looks for strong stocks in weak sectors. The system has a good performance in historical backtesting and produced another decent performance in 2019:
- # Trades: 470
- Return: 21.3%
- MDD: -6.29%
- CAR/MDD: 3.48
- RAR: 24.51%
- Win Rate: 56.17%
- Profit Factor: 1.37
- Published: August 2018
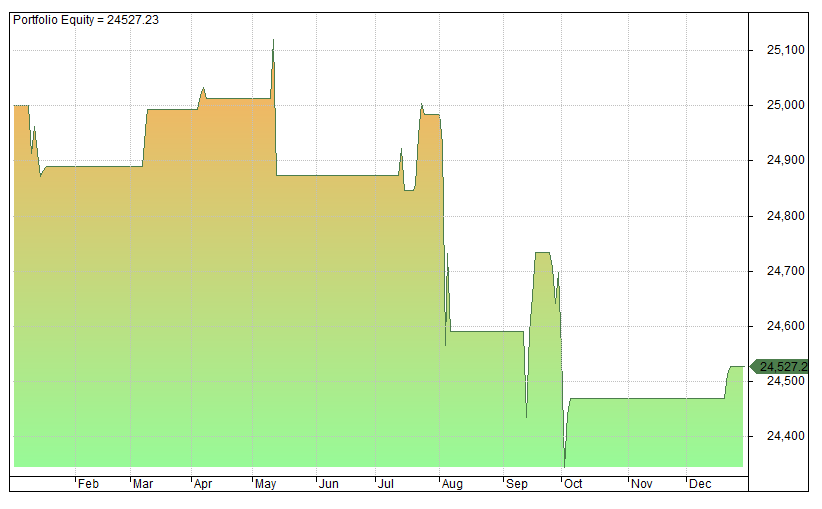
19. Triple Bottom Stocks
This strategy attempts to find triple bottom chart formations in S&P 500 stocks. Results shown are on a weekly timeframe:
- # Trades: 18
- Return: 4.3%
- MDD: -7.23%
- CAR/MDD: 0.60
- RAR: 12.56%
- Win Rate: 50%
- Profit Factor: 1.26
- Published: December 2018
20. VIX Trio
VIX Trio trades a watchlist of 3 liquid ETFs: SPY, TLT and GLD. The system continues to have an incredibly high win rate and it produced a strong RAR in our backtests.
- # Trades: 19
- Return: 16.7%
- MDD: -4.68%
- CAR/MDD: 3.60
- RAR: 109.31%
- Win Rate: 94.74%
- Profit Factor: 3.68
- Published: January 2018
21. Trading For Yield
This strategy takes positions in 5 ETFs based on price action in US yields. This system continues to do very well. In fact it makes me wonder if I have overlooked something in the backtest. If anyone has an idea please write to me and let me know.
- # Trades: 35
- Return: 36.3%
- MDD: -8.47%
- CAR/MDD: 4.31
- RAR: 70.97%
- Win Rate: 74.29%
- Profit Factor: 17.69
- Published: July 2017
22. Trend Pilot
This strategy is based on the same concept as the Pacer Trendpilot ETF. We use a walk-forward process to re-optimize the parameters and this resulted in only one trade in 2019:
- # Trades: 1
- Return: 15.3%
- MDD: -6.58%
- CAR/MDD: 2.34
- RAR: 18.29%
- Win Rate: 100%
- Profit Factor: NA
- Published: April 2017
23. Volatility Trader
We used synthetic VXX data to backtest a simple volatility strategy back to 2004. It was then applied to SVXY and VXX together and backtested to 2011 where it produced no losing years in our backtest However, it lost money for us in 2019:
- # Trades: 30
- Return: -0.8%
- MDD: -11.26%
- CAR/MDD: -0.07
- RAR: -3.30%
- Win Rate: 50%
- Profit Factor: 0.95
- Published: September 2018
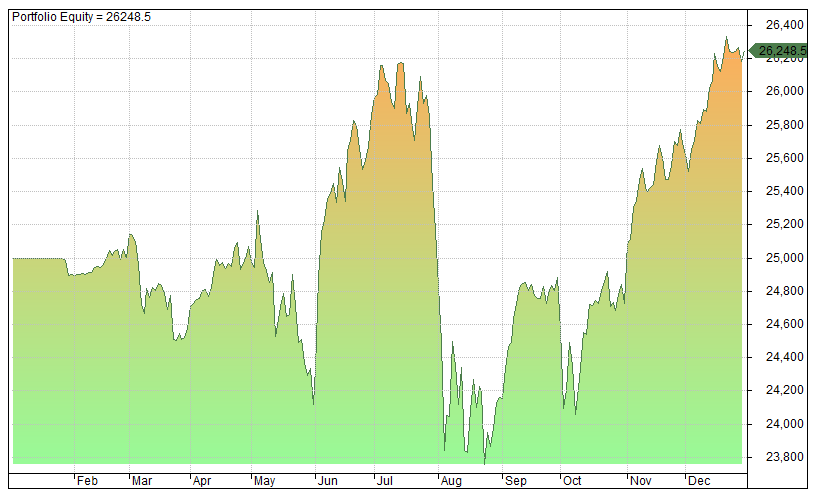
24. Follow The Money
This strategy follows trends in the Small Cap 600 universe. It has been a consistent performer for us in recent years and it produced another profitable year in 2019 with only a mild drawdown:
- # Trades: 37
- Return: 7.9%
- MDD: -6.36%
- CAR/MDD: 1.27
- RAR: 8.94%
- Win Rate: 59.46%
- Profit Factor: 1.95
- Published: May 2017
25. Trading By The Book
Trading By The Book is a classic mean reversion strategy that is enhanced with inclusion of price-to-book fundamental data. This system was published in August 2019. Unfortunately, I don’t have an update on the performance since I am no longer subscribed to the fundamental data source.
26. Shorting ETFs
This is a short only system that trades leveraged ETFs from Direxion. It has a high risk profile and only a small sample of trades in 2019. Results are also more difficult to model due to short selling restrictions and fees. This system needs a bit of work before taking it live.
- # Trades: 22
- Return: 12.66%
- MDD: -19.60%
- CAR/MDD: 0.65
- RAR: 63.95%
- Win Rate: 72.73%
- Profit Factor: 2.18
- Published: May 2017
27. Perfect Pullbacks
Perfect Pullbacks is a very basic system for SPY. However, it is created with a walk-forward process so that parameters are re-optimized every 6 months. This helps the system stay in sync with the market.
- # Trades: 11
- Return: 9.8%
- MDD: -4%
- CAR/MDD: 2.45
- RAR: 54.56%
- Win Rate: 81.82%
- Profit Factor: 2.53
- Published: July 2018
28. 60-Minute Gaps
60-Minute Gaps is an intraday system for SPY, DIA, QQQ and TLT that was published in February 2019. It trades the hourly chart and shows good performance back to 2002. Results here are provided with commissions of $0.005 per share:
- # Trades: 178
- Return: 35%
- MDD: -4.54%
- CAR/MDD: 7.77
- RAR: 68.60%
- Win Rate: 42.13%
- Profit Factor: 2.05
- Published: February 2019
29. Morning Trend
Morning Trend is a long only intraday system for the 1-hour chart. It was backtested on SPY and TLT as well as SPXL and TNA.
Performance in 2019 was better on a 2-hour chart than a 1-hour chart. Results shown here are for SPXL and TNA on a 1-hour chart with 50% margin (as per the original settings):
- # Trades: 205
- Return: 5.26%
- MDD: -12.68%
- CAR/MDD: 0.42
- RAR: 27.30%
- Win Rate: 52.68%
- Profit Factor: 1.06
- Published: April 2019
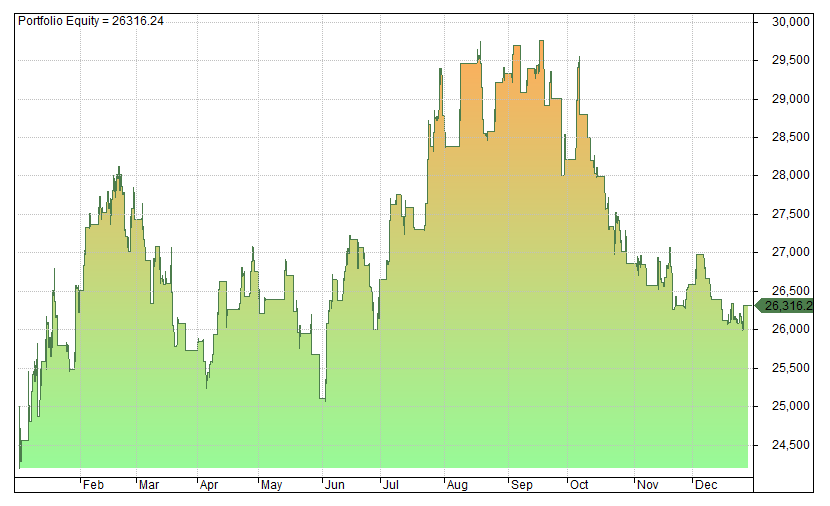
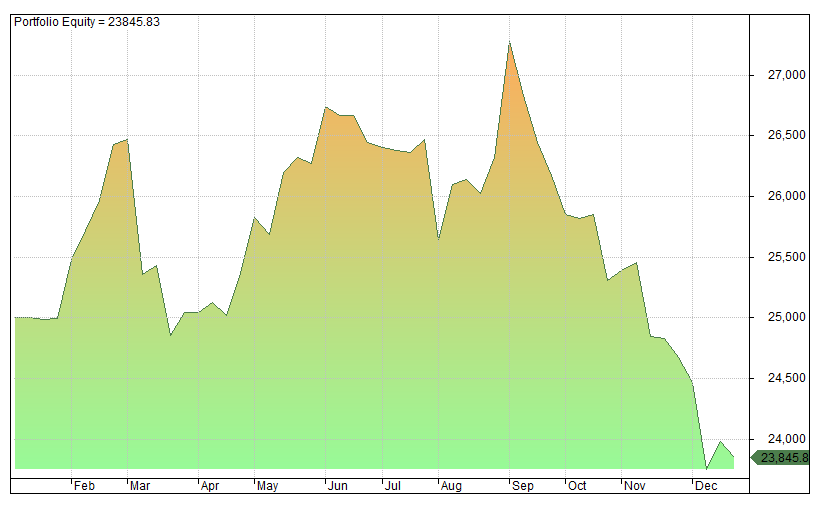
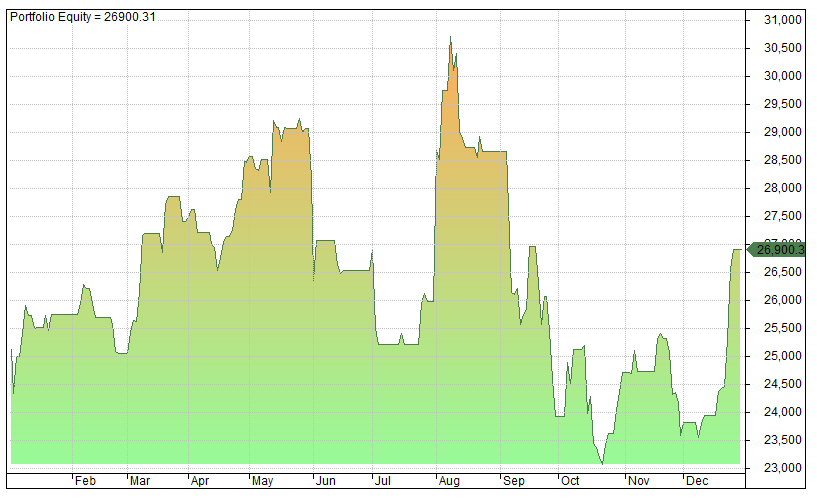
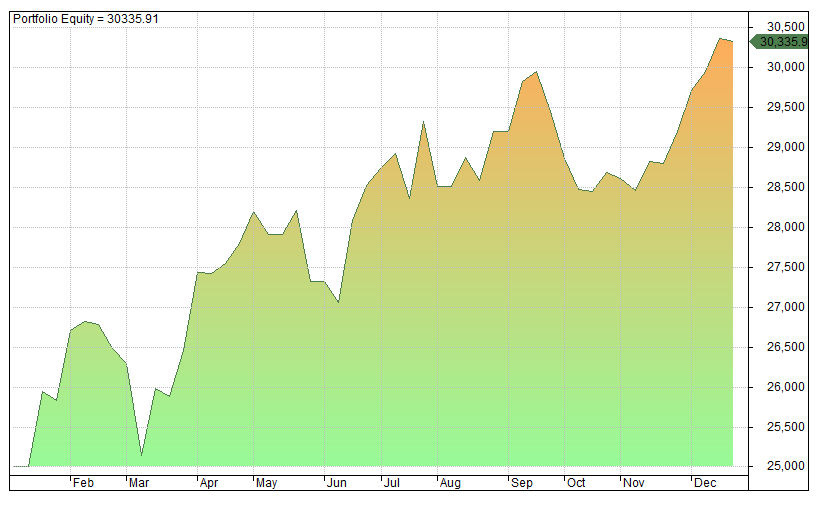
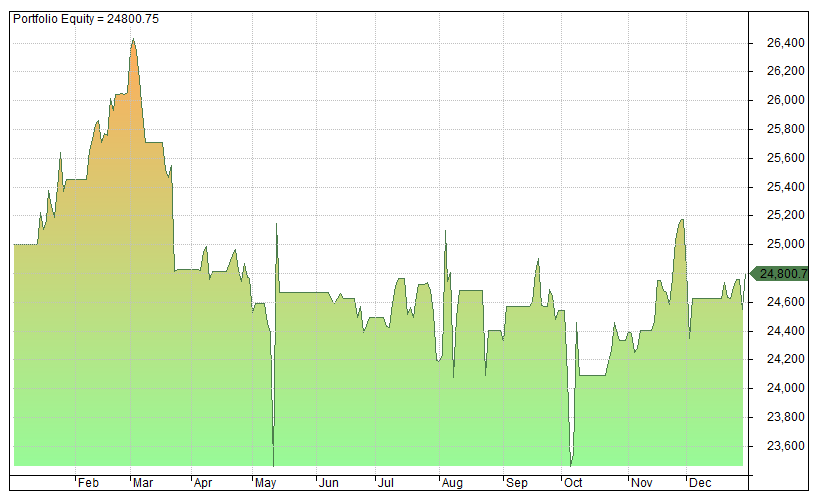
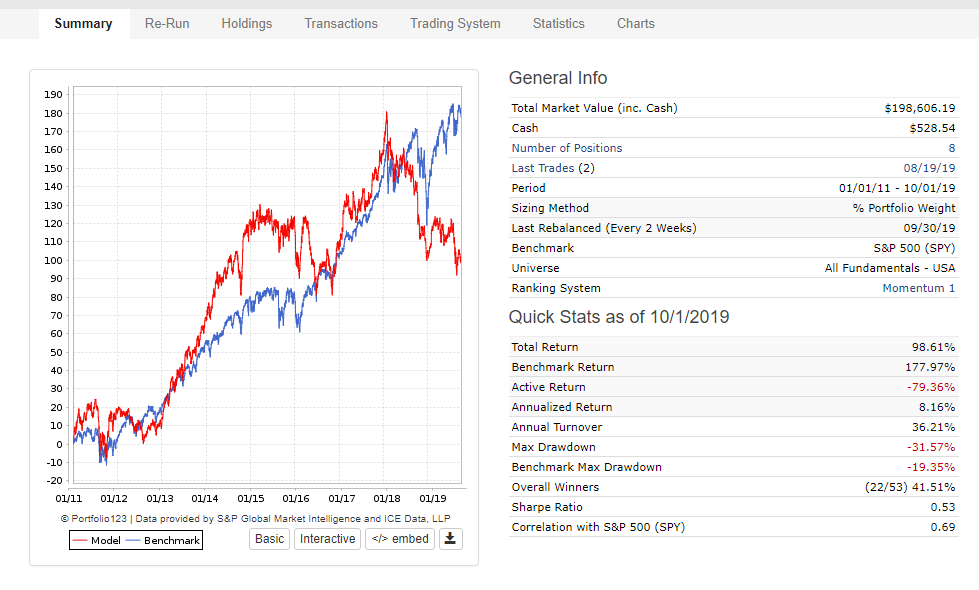
30. Value Investing Rules
Value Investing Rules used to be one of our best strategies but it has struggled in recent years and underperformed the index. Maybe value strategies will make a comeback but I have lost patience with this system and I stopped following it last year.
I don’t have the stats for 2019 but the chart below should suffice. This is a warning that even the most stress tested and logical trading strategies can underperform. I will no longer be tracking it going forward.
31. VWAP Pilot
VWAP Pilot is an intraday momentum strategy for stocks that uses the volume weighted average price to find trending securities on the 30-minute chart.
- # Trades: 461
- Return: -4.9%
- MDD: -21.95%
- CAR/MDD: -0.20
- RAR: -5.45%
- Win Rate: 40.78%
- Profit Factor: 0.95
- Published: February 2018
32. Jesse Livermore System
This system is based on the tried and trusted rules of Jesse Livermore that were documented in the classic book Reminiscences Of A Stock Operator. It finds trends in leading securities and uses pyramiding. This system was published in May 2019.
- # Trades: 30
- Return: 24.8%
- MDD: -11.13%
- CAR/MDD: 2.24
- RAR: 28.52%
- Win Rate: 40%
- Profit Factor: 2.78
- Published: May 2019
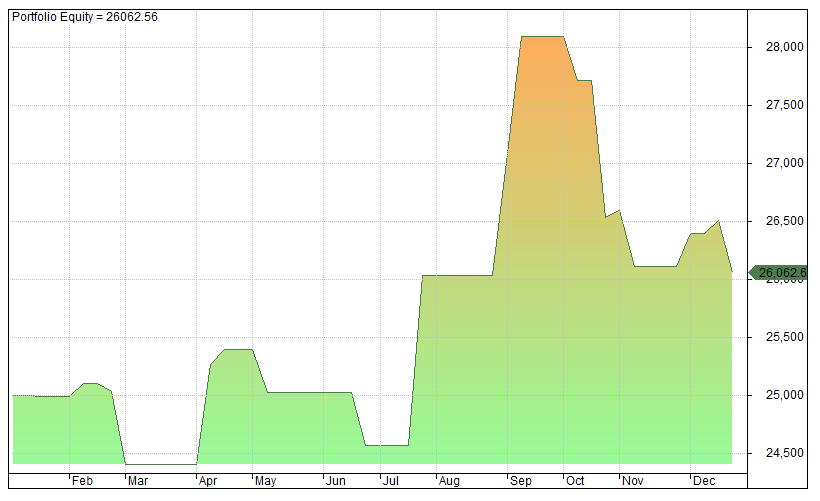
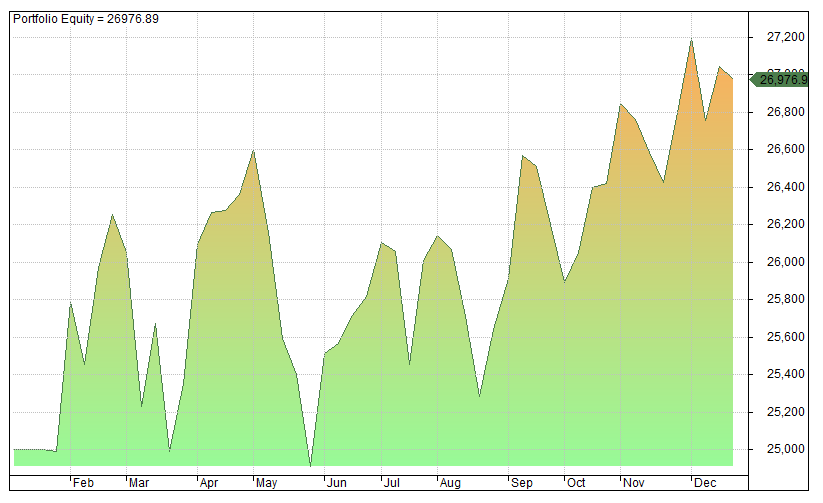
33. Trend Following Stocks
This is a classic breakout system that I created back in 2016. The system has simple rules and has been relatively consistent since publication.
- # Trades: 37
- Return: 8%
- MDD: -9.27%
- CAR/MDD: 0.87
- RAR: 8.82%
- Win Rate: 64.86%
- Profit Factor: 2.16
- Published: March 2015
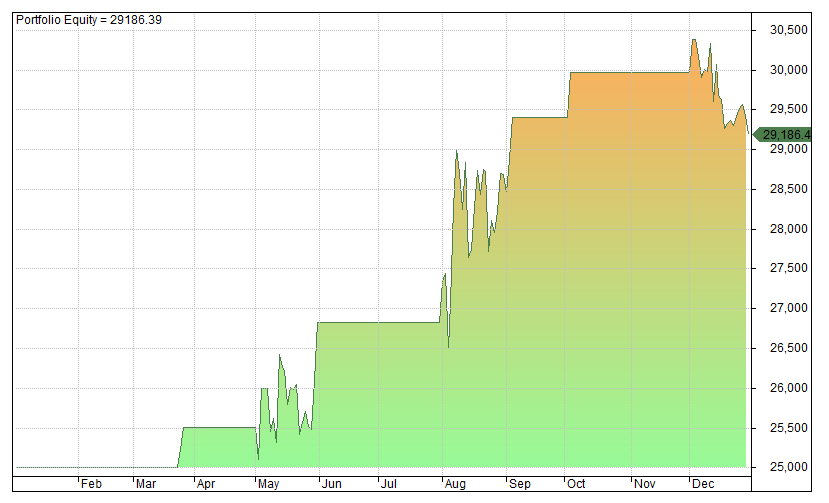
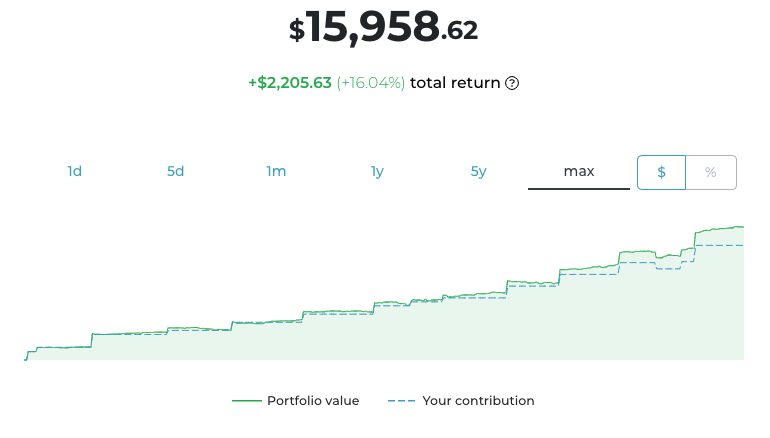
34. Zero To One Million
Zero To One Million is our monthly investing strategy that I have written about in several blog posts. The idea is to build a portfolio of high quality stocks and compound returns over a long timeframe. We produced a return of 16% in 2019 – better than the return we would have got monthly investing in the S&P 500.
- Positions: 16
- Return: 16.04%
- MDD: -13.2%
- CAR/MDD: 1.21
- Start Date: February 2019
Round Up
That is a quick round up for most of the trading strategies that I have published on Marwood Research.
There are some systems not included here, for example Daily Options Income and the Big Volatility Short which cannot be backtested. We also have several free strategies and examples that are not included here.
Overall, I am quite pleased with the performance of our strategies in 2019 with 76% showing a profitable return and only 8 systems reporting a loss.
Of course, it would have been nice to see more of our systems beat the market, however, it is not always easy to do so in strong bull years. Something that the majority of hedge funds also found out last year.
It should also be noted that these systems are far from optimal and most use no leverage. Improvements can be made to position sizing and through combining the different systems together.
Plus, I always say that the systems do not necessarily have to be followed precisely. They can also be used as a base to explore different techniques and discretionary ideas. Mixing quantitative with qualitative where it makes sense to do so.
Dear Teacher,
My name is Kumara from Bengaluru, India.
What’s your suggestions for my trading ambition on NIFTY 50, BANKNIFTY since you are well versed in S &P 500?
Please clarify. Thank You.