
A price rejection trading strategy aims to identify levels at which a price trend – either upward or downwards – will reverse as a result of the market’s reluctance to move above or below that level.
Price rejection strategies work for both long and short positions depending on the previous directional pattern. For uptrends, a price rejection pattern would result in a short position after the market has rejected a move above a key resistance.
On the other hand, for downtrends, a price rejection pattern would result in a long position as a result of the market’s reluctance to push the price below a key support.
In the following article, we will illustrate how this strategy works and how you can establish your entry and exit targets following key technical indicators.
How Does This Strategy Work?
The first step to build a price rejection trading strategy is to identify your instrument’s pivot points as well as support and resistance lines. Whether you are trading stocks, forex, or exchange-traded funds (ETF) these pivots provide signals of a potential rejection play.
These pivots can be solely based on the price action or you could also use indicators such as Bollinger bands and short-term/long-term moving averages to identify supports and resistances.
If you are using price action levels, you can further strengthen your strategy by relying on candlestick patterns to identify if intra-period price movements are further confirming a price rejection signal.
Below you’ll find an example of two typical price rejections seen in the daily chart of gold spot price (XAU/USD).
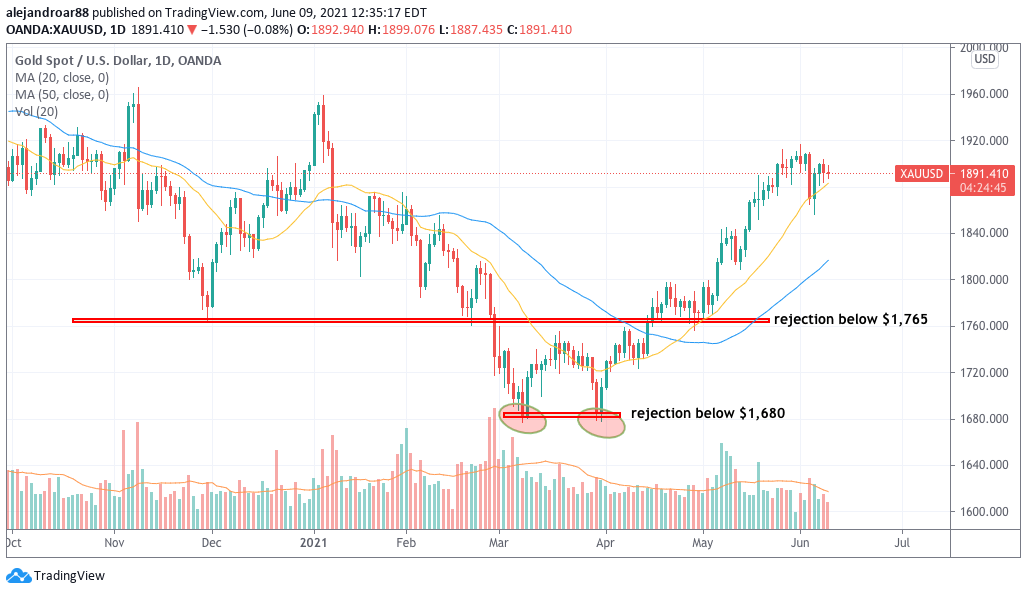
In the chart above, the first rejection occurred at the $1,680 level. Buyers showed up once the price dipped below that level on two occasions. This behavior ended up forming a double-bottom setup – a typical price rejection pattern. That led to a jump to the next resistance of $1,765 for a 5% gain.
Once the price got to that level, another price rejection play started to unfold as buyers showed up to buy any dips below the $1,765 level. This occurred as the market rejected a move below this threshold.
Finally, once short-term moving averages started to pick up, the price started to move above this level to reach a near-term top at $1,920 for an 8.8% upside.
Volumes Provide Confluence
For a price rejection trading strategy, above-average trading volumes are not necessary but they are desirable. This is particularly true when the price is tagging a pivot level for a long period. Trading volumes provide confirmation about the importance of these pivots.
Another example of a price rejection pattern can be seen in Nike (NKE) stock, with the price rejecting two different resistances on multiple occasions. The first price rejection occurred at the $147 level and the second one at $138.5.
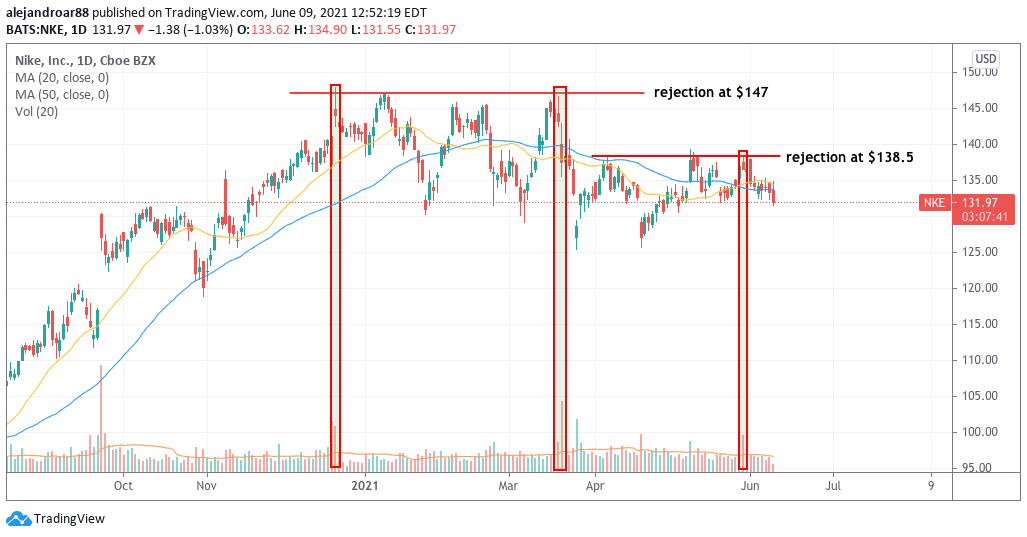
As the chart shows, volumes confirmed the importance of this price level. In this case, higher volumes increased the odds of a profitable short position once the price tagged the resistance.
In this first instance, a short position with an entry at $147 would have resulted in an upside potential of 8% or higher depending on your exit price while the second scenario (rejection of $138.5) has yielded a 4.7% gain so far for short-sellers.
To sum up, these are the technical analysis signals that traders should identify when following a price rejection trading strategy:
- Price: Two or more rejections of the same level.
- Volumes: Preferably above the 10-day average on the days that the price has tagged the pivot.
- Other indicators: For price rejection strategies, Bollinger Bands can provide further validation of the pattern along with simple and exponential moving averages while Fibonacci retracement and extensions could help in determining potential exit targets.
Examples Of Price Rejection Strategy
The following example takes a look at the latest price action in Shopify (SHOP):
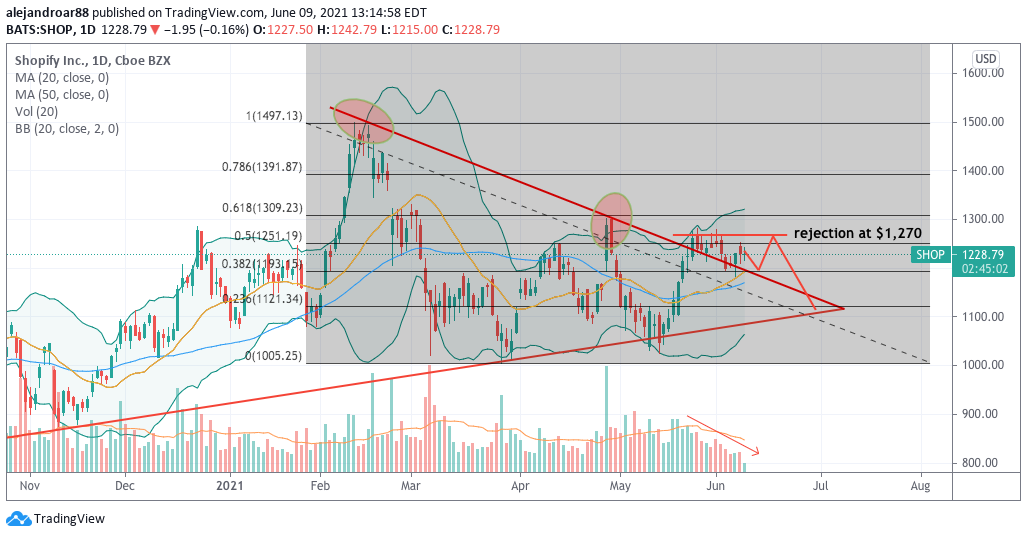
As the chart above shows, the price of Shopify broke above a key trend line resistance by the end of June 2021 but has traded below the 50% Fibonacci retracement since then.
In the subsequent six days that have followed the trend line break, market participants rejected the $1,270 level multiple times, with the stock price settling below that level on all of those occasions.
The continuous rejection of this level provides a signal that the price could move lower in the following days/weeks. That said, trading volumes have been declining which means that buyers could show up at any point to make another attempt at the higher resistance.
Failing to do so would result in an even more definite rejection of that level – a scenario that should be accompanied by a sharp drop in the share price. Keeping up with this price action and trying to trade ahead of it provides an opportunity to short the stock.
On the other hand, this price rejection strategy would be invalidated if the price moves and closes above the $1,270 level as buyers would have won the bidding.
Meanwhile, a plausible exit target for that trade could be set at the 23.6% Fibonacci ($1,121) for a potential 12% upside while a stop-loss price could be set at $1,300 for a reward-to-risk ratio of 5.
Risk-To-Reward Considerations
In a price rejection trading strategy, the maximum reward is obtained when the entry price is equal to the pivot price. Once the entry price starts to move below that level, the reward is progressively diminished as long as the exit target remains unchanged.
Considering that, aggressive traders can enter a position (long or short) at the pivot level to maximize their returns. More conservative traders can wait for the pattern to unfold – at least one or two bars after the pivot is tagged – before entering a position.
Another important consideration is that stop-loss prices should not be too tight to avoid being stopped out of the position as a result of a bull/bear trap.
The ideal reward-to-risk ratio is not fixed in stone as it would often depend on the size of the position and the trader’s win rate. However, a ratio below 1.5 is not particularly attractive as it would require an extremely high win rate that could be difficult to achieve.
In essence, the placement of stops and profit targets comes down to many hours of experience reading the market. As a trader builds confidence from this setup they gain a better understanding of what works and what doesn’t. Systematic traders can also gain confidence by backtesting rejection setups extensively on historical data.