Doing some analysis about September 11th got me thinking and I noticed that Friday is quadruple witching day.
If you don’t know, quadruple witching (or triple witching for some) occurs on the third Friday in March, June, September and December. This is when stock index futures, stock index options and stock options all expire on the same day.
Getting its name from Macbeth, quadruple witching often sees increased volume and volatility as traders close out their positions and roll them prior to expiration.
It’s also been called freaky Friday and the final hour (referred to as the quadruple witching hour) is usually the most unpredictable.
The S&P 500 On Quadruple Witching Day
Quadruple witching day usually brings volatility to the market and so you might expect to see the S&P 500 do poorly. Friday also happens to generally be a poor day for the market anyway and so that might be a factor too.
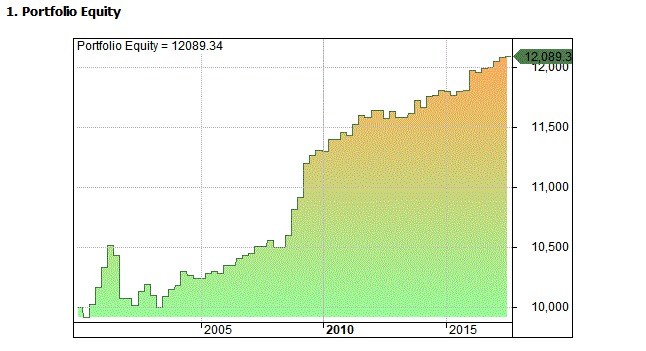
As it turns out, analysis shows that shorting SPY (the S&P 500 ETF) on quadruple witching day has been a profitable strategy since the year 2000 with a win rate of 70% and an average profit per trade of 0.28% from 69 trades.
Unless there is something I have missed this seems to be quite a persistent trade and could be taken advantage of with leverage. To clarify, the strategy is to go short SPY on the open and exit on the close. Commissions of $0.01 per share are included.
The following graph shows the equity curve:

S&P 100 Stocks On Quadruple Witching Day
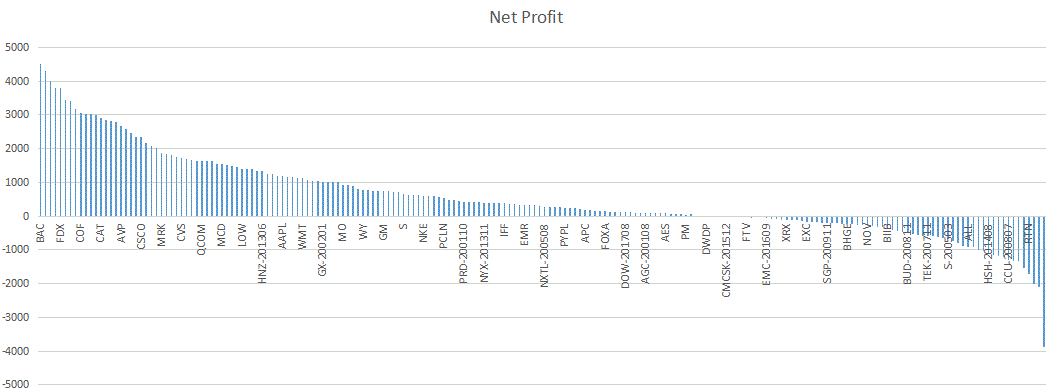
I can also tell you that the above mentioned strategy (shorting on quadruple watching day) has been profitable on some of the biggest US stocks as well, like Apple, Bank of America and IBM over the years.
In fact, this strategy has been profitable on 69% of S&P 100 stocks since 2000.
Of course, none of this necessarily means that every witching Friday the same pattern will occur. But it is interesting. And perhaps there are other factors that can help this analysis.
VXX On Quadruple Witching Day
Seeing as quadruple witching is supposed to bring volatility, an obvious choice of what to trade might be the VIX (the CBOE Volatility Index).
Although we can’t trade the index we can trade some of the ETFs that track it such as VXX. Although VXX is a flawed product that loses money due to time decay, it does have it’s uses occasionally.
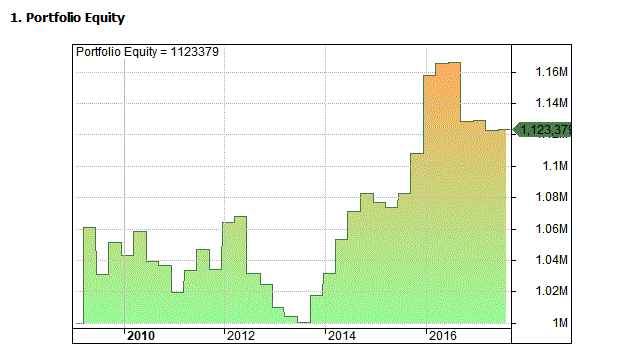
As it happens, buying the VXX ETF on quadruple witching day has been a mildly profitable signal since 2009 (when my data starts).
This strategy has been a winner 56% of the time with an average profit of 0.38% from 34 trades.
The following graph shows the equity curve:

Intraday Opportunities
The truth is that many traders have no idea about quadruple witching day and they only hear about it after the event. In fact, a number of economic calendars and news websites don’t even mention it.
But this is actually an interesting event and is probably worthy of more research. So keep an eye out for how volatility and volume unfolds, especially in the last ‘witching hour’! I’m sure there will be opportunities ahead.
September 11th Edge
It has now been 16 years since the horrific attacks on the twin towers. A day which changed the world and had a profound impact on millions of people. I remember very clearly what I was doing that day and I’m sure that you do too. It was a day that I will never forget.

Although we can never change events, we should always stay observant to what is going on around us. In the rest of this article I will look at the possibility of a new market anomaly trading on 9/11.
A New Stock Market Anomaly?
Earlier this week, I tweeted an image of the twin towers and said something along the lines of ‘let’s have a big up day’. As it turned out, the S&P 500 futures did just that, climbing 19 points and closing at new all time highs.
Obviously, this was partly a relief rally in response to a weaker than predicted Hurricane Irma. However, I couldn’t help but think the date had something to do with it so I did some analysis.
82% Win Rate
As it happens, buying the S&P 500 on September 11th has been a remarkably profitable trade.
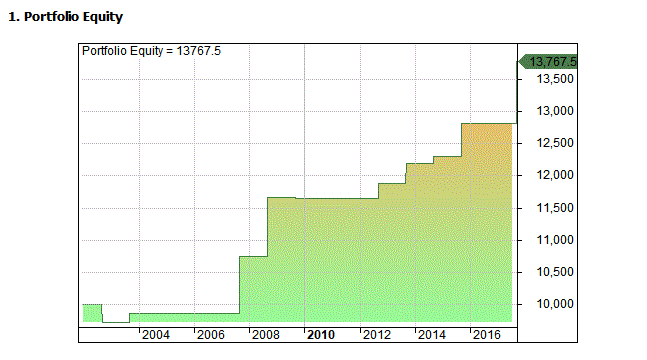
Since the attack, September 11th has occurred on a trading day 11 times in 16 years and the market has closed up on 9 of them giving the strategy a win rate of 82%.
The only years where the market didn’t finish green on 9/11 were 2002 and 2009. In 2009 the market was basically flat.
The average profit from this trade has been 6.23% or $342.50 trading one futures contract.
Below is the equity chart:

Obviously, we are dealing with a very small sample size here so it’s hard to say if the results are significant.
But, for whatever reason – defiance, patriotism etc – you can understand why the market might do well on 9/11. There are many stock market anomalies in existence and this could be a new one.
I apologize that I didn’t write about this earlier but I only thought of it after the event. I also hope I haven’t offended anyone with this trade idea. The thing is, if it makes money then it’s worth talking about.
How To Buy On September 11th in Amibroker
The following code gives an idea of how you can buy on certain dates in Amibroker. The key is to turn the date into number format as shown here:
///////////////
dn = DateNum();
Buy = ( dn == 1130911) OR
( dn == 1140911) OR
( dn == 1150911) OR
( dn == 1160911) OR
( dn == 1170911) ;
Sell = 1;
///////////////
Charts and analysis with Amibroker with data from Norgate.

