This article looks at a dividend investing strategy for income generation that shows strong returns and low drawdowns in back-testing.
Dividend investing ranks as one of the most popular and some would say straightforward stock picking strategies. It’s probably come about this way because dividend stocks are considered by many to be safer companies to invest in.
This is particularly true for large cap, utility, and blue chip stocks, the type of reliable companies that can be relied upon to pay out to shareholders year after year even when market conditions deteriorate.
As such, dividend stocks offer not only capital gains but income too.
As an example, consider an investment in Johnson & Johnson which managed to increase it’s dividend every year for something like 40 years between 1963 and 2004. An investment in 1963 would have returned a whopping 48% annual return in reinvested dividends alone.
However, just because a company pays out a regular dividend doesn’t mean it’s a sure thing and buying a stock based solely on a dividend is a flawed strategy.
Some stocks enjoy paying out high dividend yields because it attracts more investors to purchase shares. A volatile resource or gold mining stock is such an example. And since dividend yields move inversely to stock prices, a high yield can actually indicate a company that has been performing badly.
In general then, investors should look for reliable, steady dividends and companies that are able to increase dividends year after year, even through difficult trading conditions. Furthermore, through historical testing, I’ve found that the most reliable results are found by concentrating on stocks that yield between 2% and 7%.
So, when it comes to stock picking, dividends are very nice to have but they only form part of the story. Investors should consider all the other moving parts that make up a good investment and there are many factors to choose from.
In the strategy that follows, I look for stocks that are paying dividends of more than 2% but I also make sure the company has a decent balance sheet, in the form of a reasonable current ratio and a reasonable amount of cash. This is a portfolio strategy with a hedging mechanism that holds a maximum of 10 stocks at any one time.
Simple dividend strategy rules
Buy rules
• Dividend yield > 2%
• Increase in dividend over last year >5%
• Current ratio > 2
• Price-to-free-cash-flow < 10
• Ranking: Rank based on 52 week performance, choose best performing stocks first
Sell rule
• Dividend yield < 2%
• Hedge: If S&P 500 EPS estimates trend lower, move 100% into the iShares 7-10 year treasuries ETF $IEF
Settings:
• Starting Capital: $100,000
• Portfolio size: Max 10 positions, equal weighting
• Commissions: $10 per trade, 0.5% slippage (variable)
• Universe: All fundamentals (USA)
• Liquidity: Position size no more than 5% of 20 day average volume
• Diversification: No more than 30% of portfolio allocated to one industry
• Rebalance period: Every 4 weeks
• Trades entered on next day open
Strategy in plain language
This is a portfolio strategy that selects stocks from portfolio123’s all fundamentals universe (all US stocks where fundamental data is available).
When a stock meets each of the buy rules specified above, it is bought and added to the portfolio. If there is more than one signal, each stock is ranked by it’s 52-week performance and the best performing stocks are bought first.
Position size is equal weighting with no margin and no one industry can take up more than 30% of the overall portfolio.
On the next rebalance period (4 weeks ahead) any stock whose dividend yield has dropped below 2% is sold and it drops off the portfolio.
The EPS for S&P 500 stocks is monitored and if the 5 week EPS trend crosses under the 20 week EPS trend, the portfolio is moved 100% into the $IEF, the iShares 7-10 Year Treasury Bond ETF. The aim of the hedging mechanism is to keep the portfolio safely in bonds during bear market conditions.
Results
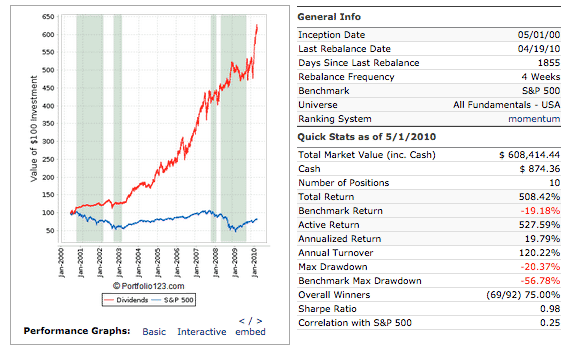
The simple dividend strategy was first run on the in-sample period between 5/1/2000 and 5/1/2010. The results are shown below: (The green blocks represent periods where the portfolio is hedged).
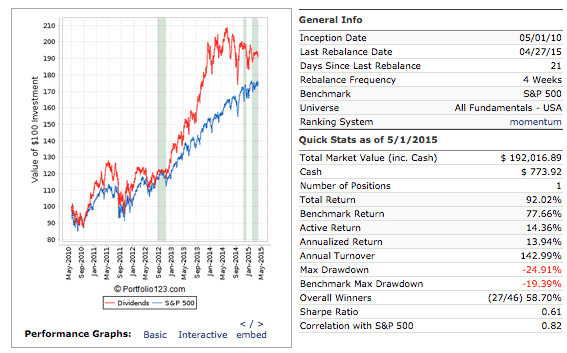
Now, the strategy was moved forward and run between 5/1/2010 and 5/1/2015:
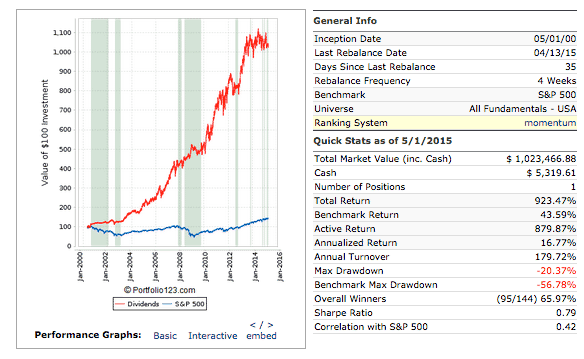
Finally, the strategy was run through the full sample period 5/1/2000 to 5/1/2015:
As you can see, the results from this simple dividend investing strategy are good over the 15 year period. Annualised return is 16.77% with an overall win ratio of 66% and a Sharpe ratio of 0.79.
The maximum drawdown is just -20.37% and the strategy recorded only one losing year (2014):
The system represents a smooth equity curve and was able to turn $100,000 into over $1 million during the back-test, much better than the benchmark (S&P 500 Index).
Final thoughts
This is a simple dividend strategy, suitable for capital growth and income generation that has potential. It was formulated in just a couple of hours using some simple, standard rules and no optimisation was undertaken.
At first glance, it looks to be a robust strategy with low drawdowns and low risk. One potential problem with the strategy is that it has not performed so well in the last couple of years. This might be a worry and more stress-testing needs to be undertaken.
Underperformance could be because dividend stocks have moved out of vogue. It could also be due to the choppy nature of recent EPS trends which has seen the hedge mechanism come into play on several occasions in recent years. It is advisable to test the strategy on various different start dates and conditions.
Overall, there are enough positives in these reports to suggest that investors are right to seek out good dividends and that the seeking of yield is indeed a worthwhile pursuit.


Great little strategy, however one cannot but think, how QE must have been impacting on this strategy.
At 16.77 I get a return assuming compounding daily of £123,656.48 for a 15 year period on starting balance of £10,000 what am I missing ?
Hi Fai, you’re not missing anything, except I used a starting balance of $100k not $10k.
You’re right, QE would have had a strong influence. It’s had a big influence on everything over the last few years. Time to think of strategies that will do well without QE maybe.
Great post. Very informative. I have wanted to include fundamentals in by strategies for some time now. Can I ask where you sourced your historical financials from?
Hi Gordon, I used Portfolio123 which has historical point-in-time data back to 1999. This data comes from Compustat and other vendors. Cheers