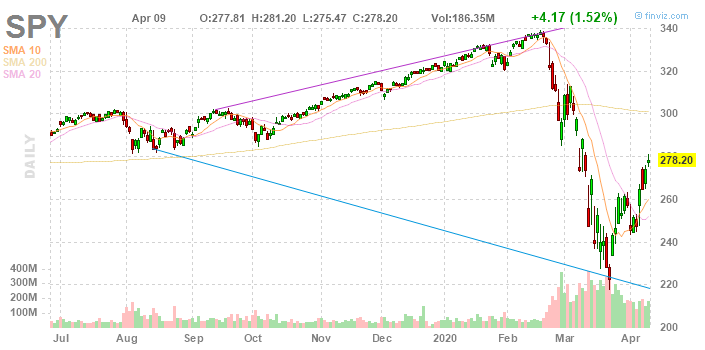
March 2020 saw one of the quickest bear markets in history as coronavirus shook the world and the S&P 500 dropped 34% in about five weeks.
Since then, the market has reversed and rallied about 24% from its low meaning it’s now down only 19% from the February peak.
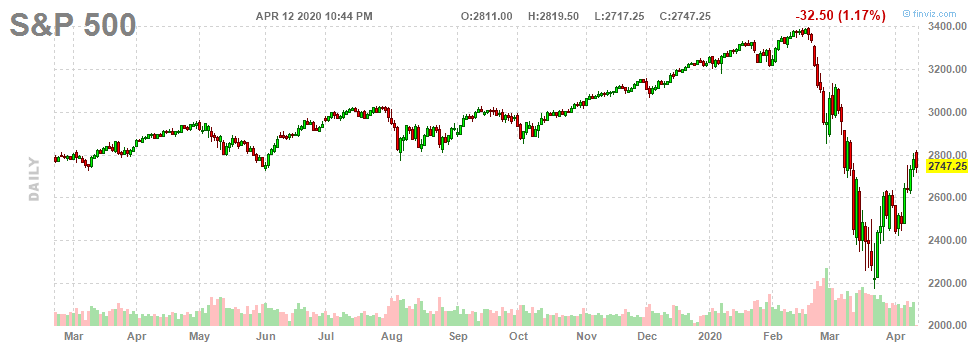
The market is now trading at the same level it did in June 2019 despite all the carnage surrounding COVID-19. It’s also approaching a key resistance area around $2800.
Although there are some positive signals for bulls we think the market could move back towards its recent lows short-term. A bear put spread gives a good opportunity to play this view.
Relief Rallies Are Common In Bear Markets
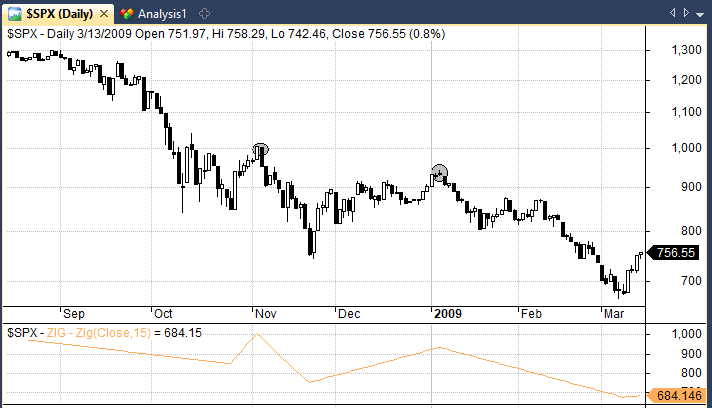
The recent rally is encouraging for bulls but if we look back at previous market crashes it’s obvious to see that relief rallies are a common occurrence in bear markets.
During the 2008 crash, there were two relief rallies of over 15% before the March 2009 low.
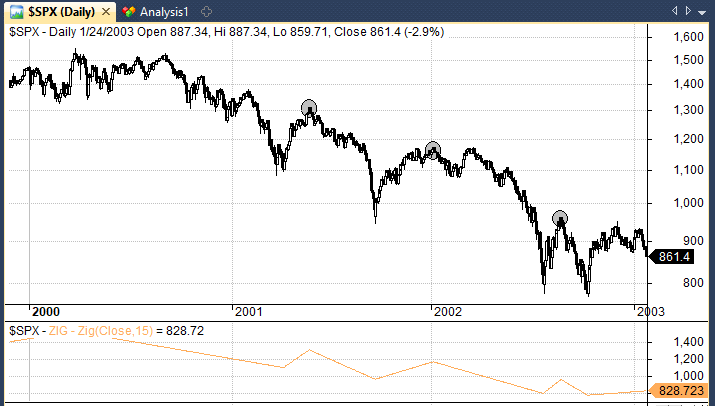
During the dotcom crash, stocks rallied more than 15% three times before the market finally bottomed.
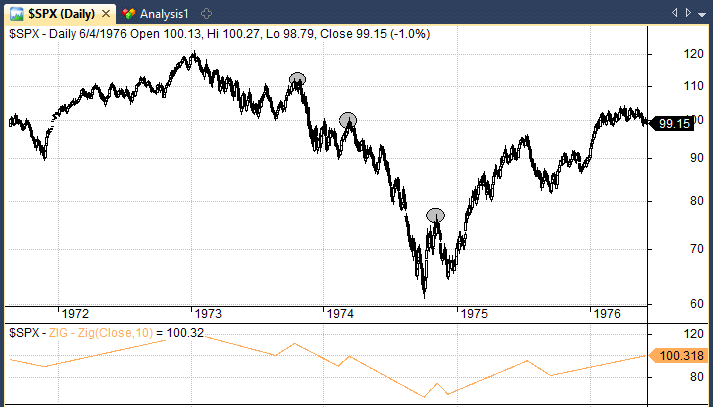
And during the 1973-74 bear market there were three relief rallies of over 10% which preceded a long period of choppy trading.
Meanwhile, during the Great Depression, there were numerous relief rallies and it took the market 26 years to regain it’s all-time high.
It’s worth noting that the 1987 and 2011 bear markets saw no relief rallies but remember that neither of these bear markets actually coincided with an economic recession.
At this point, not only is a recession nailed on but it’s likely to be a severe recession with some saying it could be on a par with the Great Depression.
Given this, it seems appropriate that there is more pain to come and that the stock market is not going to simply rebound in a straight line over the next few weeks and months.
How Much Should The Market Fall?
Historically, the average bear market has lasted around 22 months and the average drawdown has been -39%.
If we are to believe that this current crisis is worse than average (which it appears to be) then the current drawdown of -19% (albeit a pullback from -34%) seems mild.
If that’s true, then the question becomes how much damage is enough?
Answers come in many different forms. None are perfect but they can all be taken into account.
Citigroup analysts say that a good rule of thumb is for stocks to fall roughly the same as corporate earnings. They are forecasting falls in US earnings of around 50%, therefore the stock market is capable of falling by that amount as well. (FT)
Another answer is to look at the cost of the virus in terms of lost GDP. Unsurprisingly there is a wide range and a lot of uncertainty here too.
Estimates from Bloomberg put the cost at $2.7 trillion while the UN predicted only $1 trillion in a report from early March.
To put that in perspective, the 2008 crisis (which saw markets dive by 57% from their peak) is said to have cost the US about $2 trillion in lost economic output according to Moody’s Analytics. (WP).
In terms of dollar value, the coronavirus crisis could end up as costly as the 2008 crisis and some of the recent data has been right up there with the Great Depression.
US jobless claims, for example, have been truly abysmal.
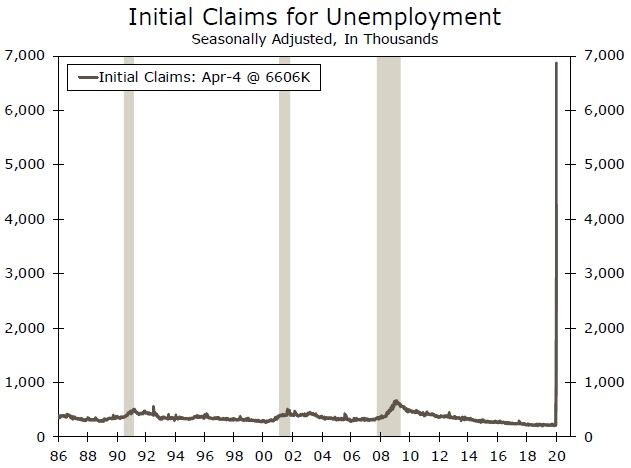
Some economists think unemployment could surge to 20% which would be much higher than in the 2008 crisis when unemployment peaked at around 10%.
Several economists are forecasting an economic contraction of between 6-8 per cent which would make it worse than the 4 per cent contraction seen in 2008/9.
However, a lot of the forecasting depends on the impact of social distancing and there is still a great deal of uncertainty.
Furthermore, putting a dollar value on the cost of a crisis is difficult when any cost necessarily depends on the reaction of the stock market resulting in a vicious cycle.
The financial crisis lingered for a long time but the coronavirus crisis could be short-lived if social distancing proves effective.
If the virus is contained effectively then it could end up costing only a fraction of the GDP that was lost in the 2008 crash.
On the other hand, if estimates do not account for second and third waves of the virus (or numerous knock-on effects caused by financial stress) then they could miss the mark.
The only data we have really seen so far are the jobs numbers. We are yet to see companies report earnings and the truth is that we are about to see a tidal wave of terrible earnings reports.
Do Central Banks Have Our Backs?
That said there is still the case that central banks have moved quickly to inject stimulus into the market to avoid financial contagion. Much more quickly than they did in 2008.
This stimulus has been large and so far been effective at keeping the financial system ticking over and helping to reduce volatility in the stock market.
Health-wise, testing has been ramped up and new virus cases have definitely been flattening.
So there is definitely a case to be made for bulls that the -34% drop represents the bottom and that investors are now looking ahead towards a recovery in 2021.
However, even if the market did hit a bottom last month there are bound to be some big bumps along the way to a recovery and there is simply too much uncertainty right now to say that the damage is done.
What’s A Fair Price?
Howard Marks said in his recent memo that the market is probably fairly priced for an optimistic view of the crisis and I think that sounds about right.
In other words, if you believe that cases are coming down, the virus is on the way out and the economy can reopen in a few weeks time, then stocks are probably fairly priced.
But if you believe that the virus is not under control and the lockdown will go on longer than expected (or that there will be future waves with more lockdowns) then stocks are expensive and have some room to fall.
At this point, it’s worth remembering that the last serious pandemic we had was the Spanish Flu which lasted about 18 months from March 1918 to the summer of 1919. In that period the virus came in three waves with the second wave being the deadliest. (TIME).
It seems unlikely that this current virus is going to just blow over and things are going to go back to normal any time soon. Especially considering the poor handling that governments have shown so far. This thing could drag on for months with second and third waves.
With that being the case, I think there is a strong argument that the market will at least move back towards it’s recent low even if it doesn’t lurch too far below it.
Where Is The Risk?
In times like these I find it helps to think simply and consider ‘where is the risk’?
Is it riskier now to buy, after a 20% rally off the low, or is it riskier to short, with the possibility of a V-shaped recovery?
For me, the risk here is clearly to the downside.
With so much uncertainty about the staying power of the virus and so much bad news yet to come, it would be risky to dive into the market when it is only 19% from it’s all-time high.
Given the gravity of the current crisis and the fact sharp rallies often occur in bear markets, I’d say the chance of us moving back to the recent low is perhaps 30% to 40%.
Given those odds, one idea is to place a bear put spread.
This entails buying one put option and writing another at a lower strike price. This is a trade I am looking to place when markets re-open on Monday. I’ve been thinking of setting it up as follows:
- Buy 1 SPY $250 Put 1-May-2020 @ $3.31
- Write 1 SPY $230 Put 1-May-2020 @ $1.31
This trade gives us the chance to profit from a move down to the recent low in SPY but caps our maximum loss to only $200 (per contract).
The graphic below from Options Profit Calculator shows our estimated returns for one contract during the duration of the trade between now and expiry on 1 May:
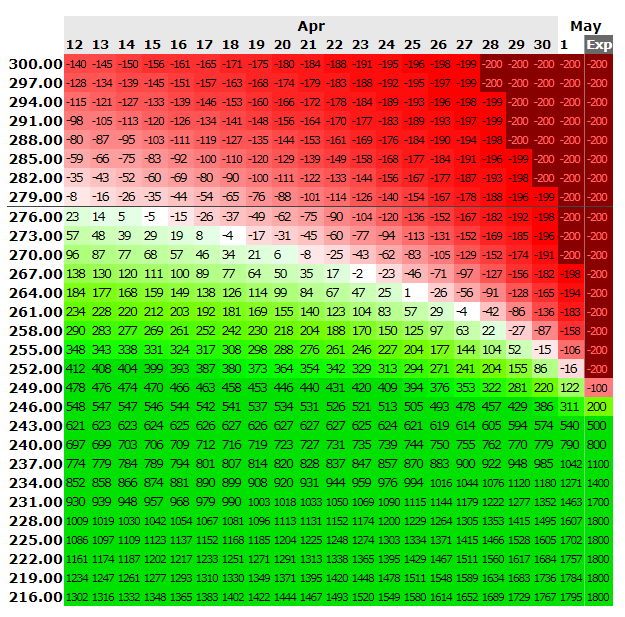
As you can see, our risk with this trade is capped at $200 but we could potentially make $1800 (900%) if the market does take out it’s recent low (a move below $220).
Even if it doesn’t take out the low we can still make a good return if the market moves lower by a meaningful amount.
A move below $250 in SPY by the 24th April would give us a 200% return which seems good value to me. That’s the kind of scenario where I would look to take profits, depending on how things pan out over the next couple of weeks.
(Note that you can do a similar trade with the index using SPX options).
Final Thoughts
The bottom line is that this is a nasty environment for investors with unprecedented economic shutdowns.
This rally has the hallmarks of a dead cat bounce. It is likely to be a complicated mix of short covering, mechanical buying and optimism that the Fed has everything under control.
We will recover from this crisis eventually but I think it will be a long slog and not a quick recovery. This means that the risk:reward is currently skewed to the downside. The bear put spread described provides a good opportunity to take advantage of this view.
Update 5/3/2020: This bear put spread has expired out of the money, however, I still think this is a good trade. I have therefore rolled the trade out to an expiry of 17 May. I may extend it further depending on what happens over the next two weeks.
—
Disclosure: The author does not have any position in any stock mentioned but is looking to place a bear trade on SPY within the next 48 hours.
Joe,
Good work in pulling together different sources of information.
What I am seeing is that there is a down turn in COVID cases around the world where countries went into to lock down early to reduce person to person transmission.
The global slow down in COVID infections is reducing the uncertainty of the pandemic crisis (an end is within sight). That information seems to be reflected in the 1 year VIX graph, even if the VIX is based on US data. I qualify that because the US was slow in responding to the pandemic so there is currently still an increasing level of COVID infections and deaths in the US compared to the rest of the world.
There will still be financial repercussions to the pandemic ( housing market price falls, when financially stretched / unemployed sellers come back into the housing market to sell into less buyers) so you need to pick what areas of the share market to get back into.
There well may be second waves of infections, which will affect the market, and there is still a lot of economic fall out to occur. World governments are acting as a market floor by socializing market losses, Whether that is good or bad is not for me to comment.
I am getting back into the market based on the VIX and the global share market behaviour.
Thanks George.
Hi Joe and thanks for a good article.
Normally I don’t like predictions, but I’ll make an exception 🙂
My view is that I don’t trust the market in general to continue up from here. When unemployment hits new highs (20% expected in the US) and many companies report catastrophic results the market is sure to move lower.
However, some sectors are doing much better.
The health sector is the shining light in Australia and I’m sure elsewhere. Also some companies in the tech sector would be doing quite nicely given people’s changing work habits and need to online gaming and entertainment.
Thanks Ola. Yes I agree that playing the different sectors could be a more optimal way to go here. Although I personally feel more comfortable playing the S&P 500 here mainly because I have been following it more closely.
Hi Joe
Thank you for the articles, please can one trade the bear spread strategy without owning the stock in your portfolio if you writing one other part of it.
best regards.
Nelson
Yes you can set up the spread at the same time. You don’t need to own the stock. Thanks.