
The last 20 years has seen the amount of research into stock market trading strategies explode. Take a look at a website like SSRN and you’ll find thousands of academic papers investigating market anomalies.
I love testing and reading about new strategies. In this post, you’ll learn about some of the most interesting strategies that I’ve come across.
Stock Market Strategies – Seasonal Anomalies
1. The January Effect
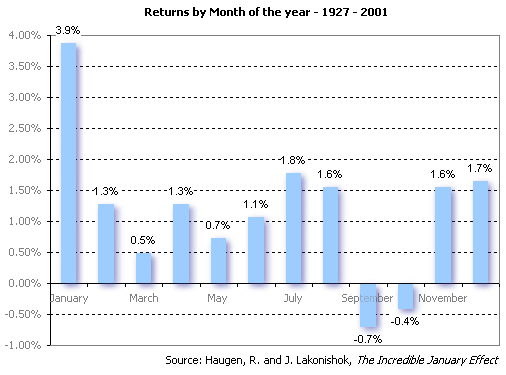
The January effect describes the tendency for small cap stocks to outperform large cap stocks during the month of January. This is a well known anomaly. It’s been discussed in numerous journals and research papers going back as far as 1942 – Sidney Wachtel.
Another study, by Rozeff and Kinney, looked at data between 1904-1974. It found that market returns were as much as five times greater in January than any other month.
Numerous studies have been done since then with differing opinions over the effectiveness of the strategy in recent times. Some academics suggest that the effect has dwindled in recent years as more investors become aware of the anomaly. Ziemba suggests the anomaly has simply moved to December.
As more people become aware of a market anomaly it’s logical that it begins to break down. More investors try to anticipate the trade. It either shifts to an earlier time or is arbitraged out.
Explanation
Possible explanations for this anomaly are tax loss harvesting, window dressing (accounting) and investor psychology.
Strategy:
You can capitalise on this anomaly by going long a basket of small cap stocks and simultaneously shorting a basket of large cap stocks during the month of January.
This can be achieved with E-Mini futures or ETFs. You may want to initiate the trade at the end of December as the effect seem to gets earlier each year.
2. Day Of The Week Effect
The day of the week effect is also known as the Monday effect or weekend effect. It describes the tendency for stocks to perform worse on Mondays than other days of the week, particularly Fridays.
This anomaly has been described in several academic studies. It has been analysed across different international markets and it’s one of those anomalies that seems hard to rationalise.
One explanation is that investors become more optimistic as the weekend approaches and more pessimistic on Mondays. However, this could also be a case of HARKing (hypothesising after results are known).
Some academics (such as Lakonishok) attribute the weekend effect to the turn of the month effect anomaly.
Others suggest that more bad news comes out over the weekend with more companies reporting negative earnings after Friday’s close.
Perhaps another explanation is that more short sellers exit their positions on Fridays and reinstate them on Mondays in order to avoid any upside risk over the weekend when markets are closed.
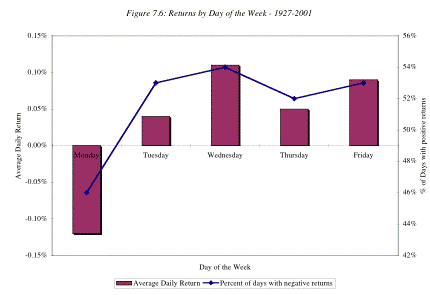
there are also some (e.g. Sullivan) who suggest that the anomaly is not significant and is probably the outcome of data mining. In the next chart from Stern School of Business, you can see how Monday provided net negative returns in stocks between 1927-2001:
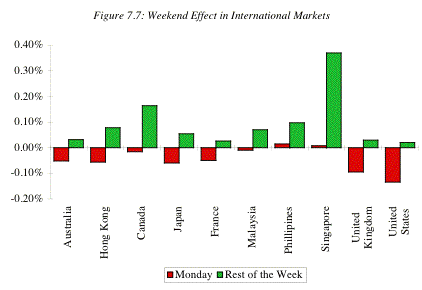
In the second chart, it’s clear that the weekend effect is fairly robust over international markets too:
Strategy:
Stocks tend to fall on Mondays relative to other days of the week. You can use this information to avoid buying stocks on Friday close or Monday morning.
3. Turn Of The Month Effect
Stocks tend to rise during a small window between the end of the month and beginning of the next month.
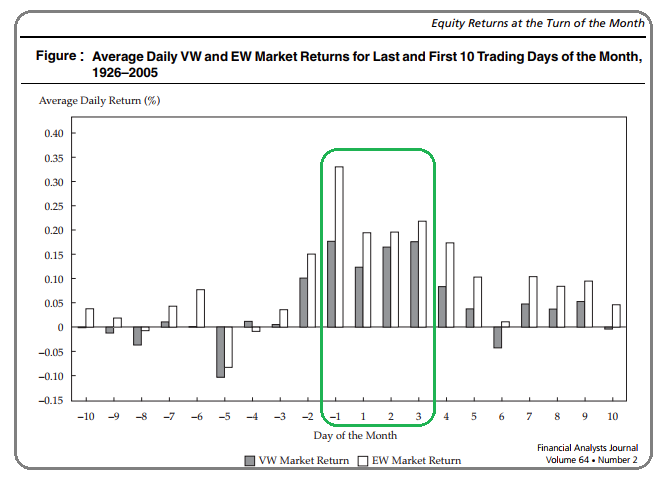
According to Eddy Elfenbein, most of the S&P 500 capital return has come during a seven day window at the turn of the month. Specifically, the last four trading days of the prior month and first three days of the next month.
This anomaly has also been documented by Ariel, Fosback, Merrill and others. Ziemba also finds that the anomaly is present in international markets, particularly Japan.
In the book The Handbook of Equity Anomalies, the authors show that the anomaly still exists albeit with some anticipation.
Explanation
This quite a robust anomaly and there are a number of rational explanations.
Since most salaries are paid towards the end of the month, investors typically put their money into the market during this time and this causes stock prices to rise.
Other explanations include portfolio window dressing and rebalancing. Pension fund investment moves and brokerage firms implement sales pushes towards the end of month (in order to meet targets).
The following chart from the Financial Analysts Journal clearly shows how stock returns have clustered around the turn of the month:
 Strategy:
You can lock-in gains from the turn-of-the-month effect by going long stock indices three to four days before the end of the month. You can then exit longs five to six days later.
4. Holiday Effect
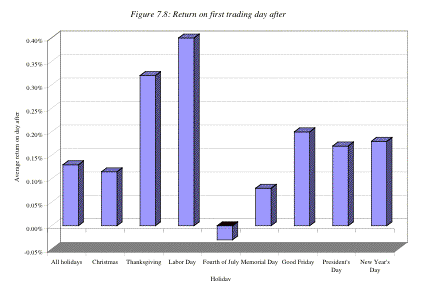
The holiday effect shows that stocks tend to rise on the day after market holidays.
One explanation of the holiday effect is that the market rises by an adequate amount in order to make up for the lost trading day. However this theory runs contrary to what happens when markets reopen after the weekend, known as the Monday effect.
An alternate explanation for the anomaly is that investors come back to their desks in a more optimistic mood and are more likely to buy equities.
Another idea is that while US markets are closed for the holiday, foreign markets are direction-less and less liquid. They tend to drift higher resulting in a higher open for the US market on the day after the holiday.
As with all market anomalies, there is also the possibility of data mining or natural variance. Just because a market anomaly worked in the past doesn’t mean it will continue in the future.
The following chart from Stern NYU shows how average returns for the first trading day after a holiday have been net positive for all holidays except the Fourth of July. The day after Labor Day is best with an average return of almost 0.40%:
Strategy:
You can buy stock index futures or baskets of stocks on the close of trading before a market holiday. You can then exit at the close on the next full day of trading to lock in gains.
5. Time Of Day Effect
Traders know that the majority of trading volume takes place at the open and close. The late morning and early afternoon sessions are usually quiet. Trading outside of these busy hours is a bad idea for day traders.
Old research from Harris (1986) also revealed a time of day effect. He showed that equities tend to rise in the first 45 minutes of trading except on Mondays.
In addition, stocks are more likely to rise towards the close on all days, particularly smaller cap stocks.
There has also been research to show an overnight effect. One study showed that investing in the S&P 500 in the overnight session produced stronger returns with lower risk than during the day.
An explanation for the overnight anomaly is that companies release more of their important information after the market is closed. After all, earnings reports are what drive stock markets.
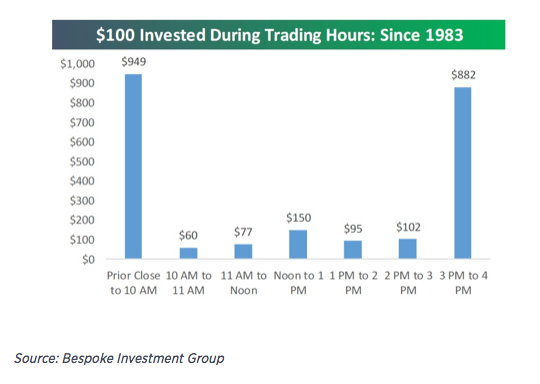
The following chart from Bespoke Investment Group shows how stock returns are concentrated in the final hour of trading and overnight.
 The next chart from falkenblog shows how overnight returns in the S&P 500 have been well in excess of day returns. If you had not held trades overnight during this period you would have performed very poorly:
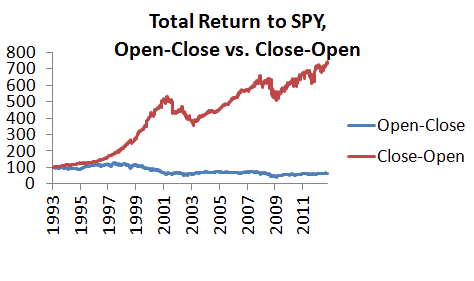 Finally, there is evidence from Haoyu Xu which postulates that stocks exhibit a momentum effect in the morning and a reversal effect in the afternoon. In other words, if a stock trended lower in the morning it might reverse higher in the afternoon.
The explanation for this is that morning trades are more likely to be information driven. Afternoon trades are based on liquidity and dominated by institutional trading.
Day traders should focus on momentum strategies in the morning and reversal strategies in the afternoon.
Strategy:
Markets behave differently at different times of the day. You can use this information to construct for timing entries.
The last hour and overnight session often sees the most positive price movement. Momentum trades should be preferred in the morning and reversals in the afternoon.
6. Santa Claus Rally
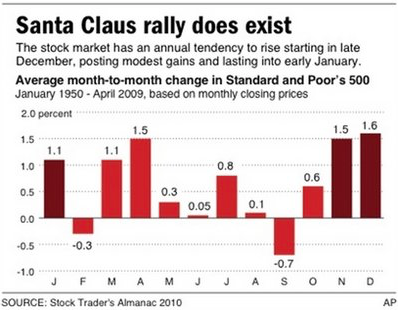
The Santa Claus rally is the tendency for stocks to rise in the holiday period between Christmas and New Year.
According to Business Insider, the Dow Jones Industrial Average gains an average of 1.7% during this period. It rises 77% of the time in data going back to 1896.
This anomaly has a few things going for it because It’s the combination of several other known effects. Holiday effect, turn of the month effect, and turn of the year effect combined.
This anomaly can, therefore, be explained by the combination of these factors.
Finally, the lack of liquidity during this period might also be a contributor to an upward drift in prices:
Strategy:
You can buy index futures or baskets of stocks on the first trading day before Christmas Eve and look to exit trades on the first trading day of the new year. This trade works especially well if the market is down in the run up to Christmas.
7. Sell In May And Go Away
This is an old trading cliche that stuck over time. It explains the tendency for stocks to do worse during the period between May to October. Investors can outperform by holding stocks outside of this window.
This anomaly has shown more positive results outside the US than in the US. Figures show decent performance from June to August with the poorest returns coming instead in September and October.
Different date ranges show a very different spread of returns which highlights the dangers of basing stock market strategies on small sample sizes.
This anomaly is unlikely to be based on any market truth. It’s more likely the result of natural variations in monthly returns. It’s also a difficult anomaly to take advantage of because it means tying up capital for a long period.
The following chart from Ibbotson shows how ‘Sell in May’ has not worked out so well in the S&P 500. A better rule would be to sell in September: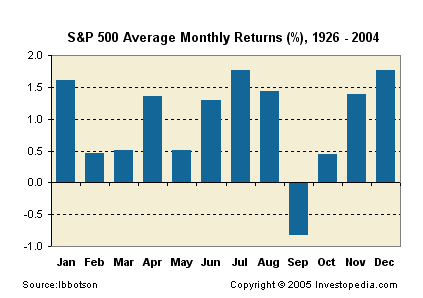 Strategy:
This anomaly should not be actioned on by itself but it could be useful as part of a broader composite indicator. For example, using Sell In May as one ranking factor in a market timing strategy. See this article on Blair Hull for more information about combining factors.
Stock Market Strategies – Price Based
8. Momentum Effect
Momentum has been described as one of the most persistent stock market strategies.
The premise is that a stock in motion tends to stay in motion. Investors capitalise on this phenomenon to earn above average market returns.
One of the first studies on momentum came from Jegadeesh. They measured the price momentum of stocks based on three to twelve month rolling returns.
Jegadeesh found that stocks with the strongest 12-month returns went on to outperform the market over the next 12 months. Similar findings were found in monthly intervals down to 3 months.
Other momentum strategies have been published which include closeness to the 52-week high and entries using moving averages.
A paper by Park showed that sorting stocks based on the ratio between the 50-day moving average and 200-day moving average provided monthly returns of 1.45% over 6-months.
The idea is you divide the 50-day MA with the 200-day MA and go long the stocks in the top decile (winners). You then short stocks in the bottom decile (losers).
Several studies have concluded it’s wise to ignore the most recent month in momentum calculations. This is because the most recent month tends to show price reversal instead of momentum.
In the case of 12 month momentum by Jegadeesh, the most recent month is left out of the calculation.
More recent studies have failed to discredit momentum as a viable market anomaly. It remains one of the better market edges available to ordinary investors.
One study looked into the overall profitability of 447 market factors, and found up to 85% were insignificant. But momentum factors were frequently mentioned as among the most significant of those 447 tested.
Momentum also has a long history of good performance as illustrated by the following graph from Geczy and Samonov:
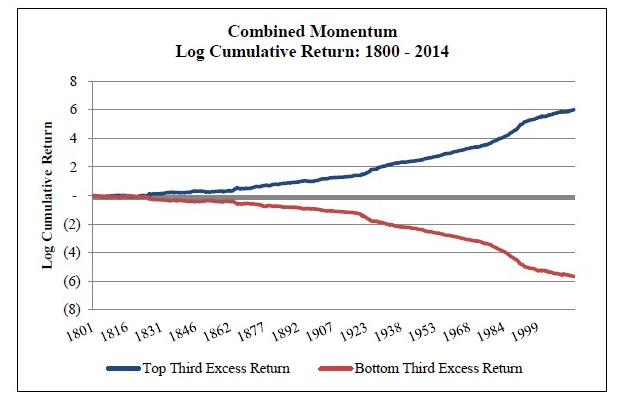
Strategy:
There are numerous different strategies that investors can use to exploit the momentum anomaly. Momentum systems can be based on moving averages, breakouts or percentage returns.
9. Reversals And Mean Reversion
Studies have shown that momentum works best over a time horizon of around 3 to 18 months.
Less than that, or longer than that, and you are more likely to see a reversal. This is often described as mean reversion or regression to the mean.
One study, from De Bondt and Thaler (1985), found that the biggest losers over a period of three to five years earned higher average returns over the next three to five years. Meanwhile, the biggest winners earned lower average returns.
In other words, they found persistent mean reversion over a period of three to five years.
Additional research has shown mean reversion occurs on much shorter timeframes.
In a study by Dunis et al, the authors found that reversals typically occur overnight after large price falls. Other studies have shown price reversal over a one month period.
There is also documented mean reversion in fundamental data like earnings and accruals, intraday data, volatility and in the aftermath of short selling.
Like momentum, numerous research has been done on the subject of reversals and mean reversion. A number of mean reversion strategies have been detailed on this blog and in our research program.
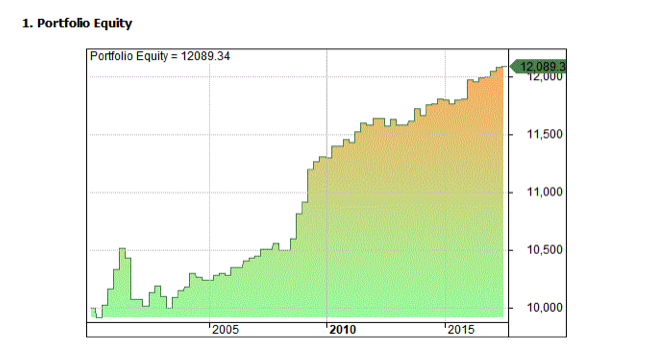
The following equity curve shows a typical mean reversion system that we detailed on this website:
Strategy:
Mean reversion strategies involve looking for extreme price movements that are unusual and likely to revert back to more normal levels. They can be explored on various timeframes and in various settings. For a more detailed guide see this post on How to build a mean reversion trading strategy.
Stock Market Strategies – Financials
10. Size Effect
The size effect, also known as the small firm effect, is the tendency for small cap stocks to outperform large cap stocks.
Smaller cap stocks are typically referred to as companies trading for less than $2 billion in market cap. The small firm effect is one of the three factors in the Three Factor Model by Eugene Fama and Kenneth French. (The two others are CAPM and value).
Explanation
One explanation for the size effect is that small cap stocks are simply more risky than large cap stocks. They must therefore command a higher rate of return.
Another explanation is that small cap stocks have the ability to grow faster than larger companies. Large companies can be constrained by their own level of success and size of the market.
However, the size effect has been called into question by some researchers who say the anomaly is inconsistent, concentrated among microcaps, and strongest in the month of January.
The following graphic from Aswath Damodaran uses data from Ken French. It calls the small firm effect into question and illustrates how most of the returns have come in January:
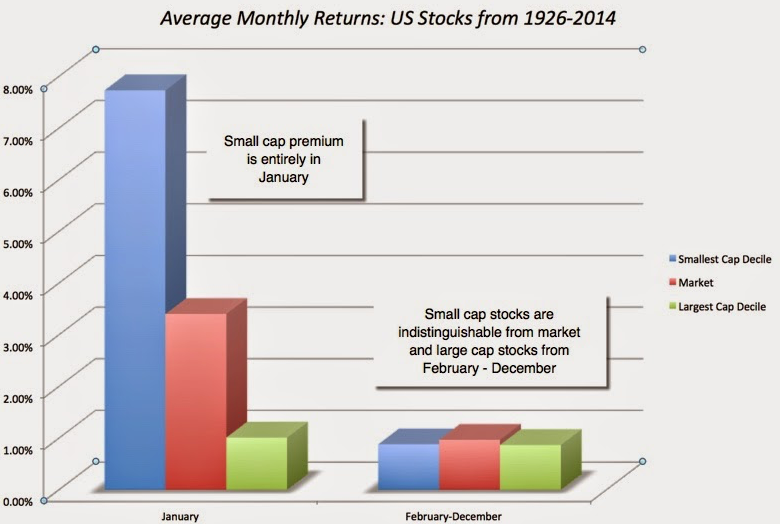
Strategy:
There is evidence that the small firm effect has weakened. However, investors may still outperform by selecting small caps with higher quality earnings (as discussed in this paper by AQR).
Also, the small firm effect is clearly more prominent in January. You can buy baskets of small cap stocks and simultaneously short large cap stocks.
11. Book-to-Market (Value Effect)
The value effect is commonly referred to as the book-to-market effect. It dates back to famed value investor Benjamin Graham.
This anomaly has also been discussed by numerous well-known researchers including Basu, Titman and Fama and French.
A seminal paper by Fama and French in 1997 showed a difference of 7.6% average returns between high and low book-to-market stocks. Value stocks outperformed growth stocks in 12 out of 13 major indices.
What is book-to-market?
The book-to-market anomaly compares the book value of a company to its market price. The larger the book-to-market ratio, the cheaper the company is on a fundamental basis.
For example, if a stock has $100 million in real assets but is valued with a market cap of only $80 million, the B/M ratio is 1.25 (100 / 80).
You can say the stock is trading below its book value and is fundamentally cheap. If you were to strip the company and liquidate all the assets you would end up with more cash than the current market value (that is assuming the assets are valued correctly).
The book-to-market effect is one of those anomalies that makes logical sense. It also has a good history of outperformance.
Explanation
Explanations of this anomaly are mostly behavioural based.
One explanation is that investors overpay for growth stocks with compelling narratives and so value stocks get overlooked and undervalued. Investors overweight past performance into their investing decisions.
Another explanation is that high book-to-market stocks are often distressed companies and therefore entail higher investment risk.
An obvious drawback of the book-to-market anomaly is that it only takes into account one variable.
Famed value investors such as Warren Buffett would say that it’s best to look at the book-to-market ratio as simply one piece of a much larger puzzle.
The following chart from Slideshare shows an illustration of the book-to-market effect with data from 1927 – 2007: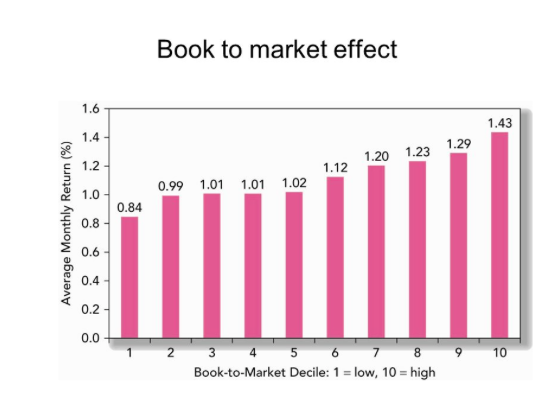 Strategy:
You can calculate the book-to-market ratio using the total book value of the stock divided by the market capitalisation of the shares. You can then scan for stocks with high book-to-market values and use these as a basis for further investigation.
You can also construct a market neutral portfolio by going long high book-to-market stocks and going short low book-to-market stocks.
12. P/E Ratio Anomaly
The P/E ratio effect says that low P/E stocks produce higher risk-adjusted returns than high P/E stocks.
This is another classic value investing anomaly that has been supported by value investors such as Warren Buffett, Joel Greenblatt and Howard Marks. It’s been written about by researchers including Basu and Shiller.
A key insight concerning the P/E ratio is how it encapsulates investor sentiment. If a stock has a high P/E ratio, its price is high relative to recent earnings. Investors are therefore expecting that stock to grow quickly and produce higher earnings in the future.
A stock with a low P/E ratio, meanwhile, is less expensive relative to recent earnings. Investors are therefore less optimistic on growth.
Low expectations are more easily overcome and this is why a low P/E ratio can indicate an undervalued company and a good investment opportunity.
The P/E ratio is a noisy signal but there has been lots of research into its effectiveness.
Professor Shiller produced one of the most well known studies into the P/E ratio. He showed a clear correlation between low P/E and forward returns. In the following chart you can clearly see the relationship: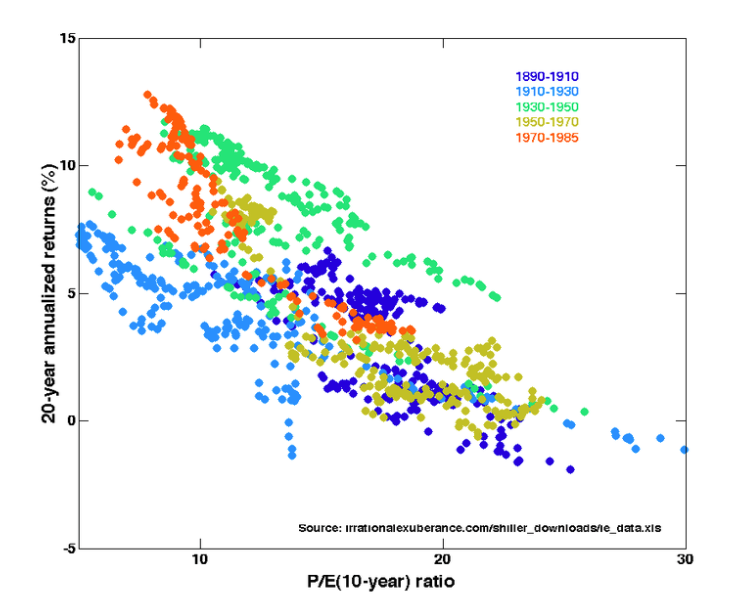
Strategy:
According to this anomaly, you should prefer low P/E stocks when constructing your portfolio. You could also construct a market neutral portfolio by going long the lowest P/E stocks and going short the highest P/E stocks.
13. Closed-End Fund Discount Anomaly
If I was to offer you the chance to buy $1 worth of assets for 80 cents, you’d think the opportunity was too good to be true.
However, that is exactly what happens in the case of closed-end funds which commonly trade at significant discounts to their net asset values.
As a result, the closed end fund discount has been called ‘one of the most puzzling stock market anomalies in finance’.
An example of a CEF anomaly was discussed in the book A Random Walk Down Wall Street by Burton Malkiel.
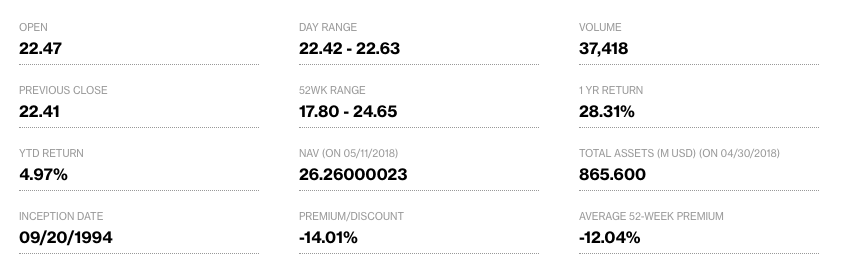
For a more recent example, consider the case of TDF, the Templeton Dragon Fund.
According to Bloomberg, TDF has a net asset value of $26.26 per share. However, the stock opened at $22.47 last week and then closed at a price of $22.58. That’s a discount to NAV of -14.01%.
In other words, you can currently pick up $26.26 worth of assets for $22.58.
Bloomberg shows the NAV and the premium/discount on its quote page for most CEFs and ETFs:
There are many subtleties to the closed-end fund discount and numerous explanations have been put forward for its existence.
Some experts suggest that the discount reflects illiquidity of the underlying assets, management fees, transaction costs and the difficult of valuing NAVs accurately.
Important
A key issue with CEF investing is that a discount can persist for years at a time. Even if you find a significant discount there is no guarantee that you will ever be able to sell for a profit.
It’s for this reason that many hedge funds implement mean reversion strategies by using Z scores to find CEF discounts that are deviating from average values.
If a CEF typically trades at a 10% discount to NAV, they will only go long if the discount widens and the z score drops below, say, -2.
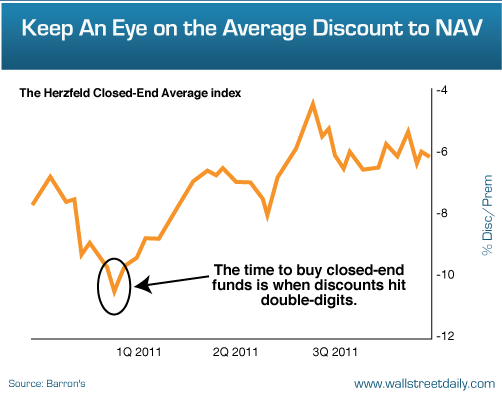
Another aspect of the closed-end fund discount is its applicability to market timing.
Closed end fund discounts narrow during bullish environments and get wider during market stress. Therefore, they can be used as a guide to the current nervousness in stock markets.
Strategy:
CEFs often trade at a discount to NAV and can become mis-priced. However, the discount can persist for some time.
You can use mean reversion strategies to go long a CEF when its discount is significantly below its usual level and look to profit when the gap closes.
You can also use the CEF discount/premium as a guide to market stress and therefore help implement market timing strategies.
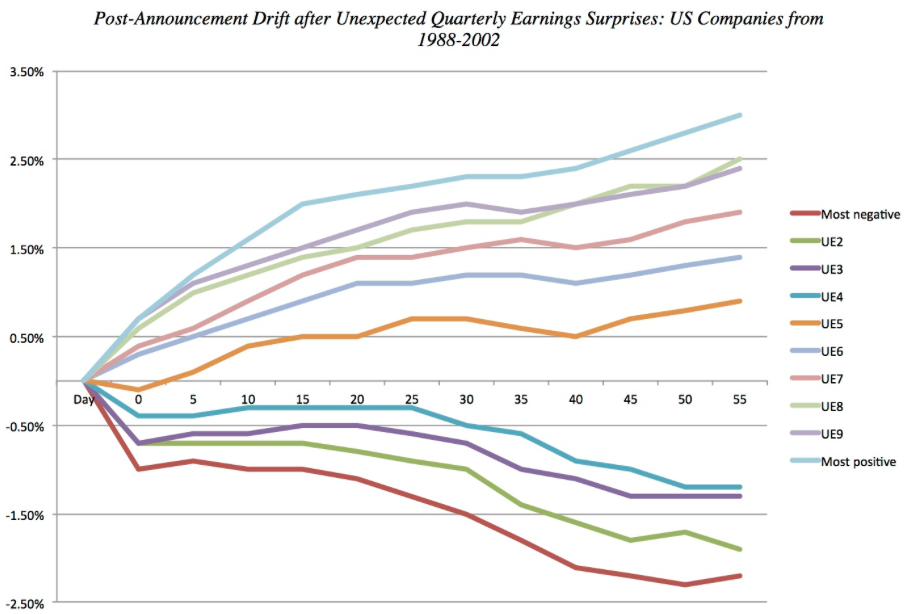
14. Post Earnings Announcement Drift (PEAD)
Post earnings announcement drift (PEAD) is another one of the most significant stock market anomalies to have been discovered.
The idea is that when a stock releases earnings that are a big surprise to the market, the stock tends to drift in the direction of that surprise (positive or negative) for up to 60 days.
The observance of PEAD suggests that the market is not perfectly efficient. According to a paper by Brandt and Kishore, PEAD is capable of abnormal returns (in excess of the market) of about 12.5% annually.
Explanation
The most popular explanation for PEAD is that investors typically under-react to earnings surprises and it takes time for the new information to be priced into the market.
The following chart from Mr. Damodaran shows the effect very clearly:
Strategy:
The way to trade PEAD is to buy stocks with the strongest positive earnings surprises and short stocks with the strongest negative earnings surprises. Trades can be held from 1 to 60 days after the announcement to capture the drift.
15. IPO Effect
The IPO effect has baffled academics for several decades and is the result of three unusual price patterns that are typically associated with new public stock offerings:
- The first day of trading for new IPOs sees abnormal returns
- IPOs typically underperform over the longer term
- IPO underperformance moves in cycles
According to Mahjoub, by the end of the first day of trading, US IPOs between 1990-2007 traded on average 18.9% above their offer price at which the company sold them.
This pattern of underpricing also held strongly in the 1960s (21.2%), 70s (9%) and 80s (8.2%).
But it reached its peak in the Internet bubble of 1999-2000 where an estimated $66.63 billion was left on the table based on the starting price of US IPOs in that time period.
Meanwhile, separate research from Jenkinson and Ritter seems to illustrate that this anomaly is a global phenomenon: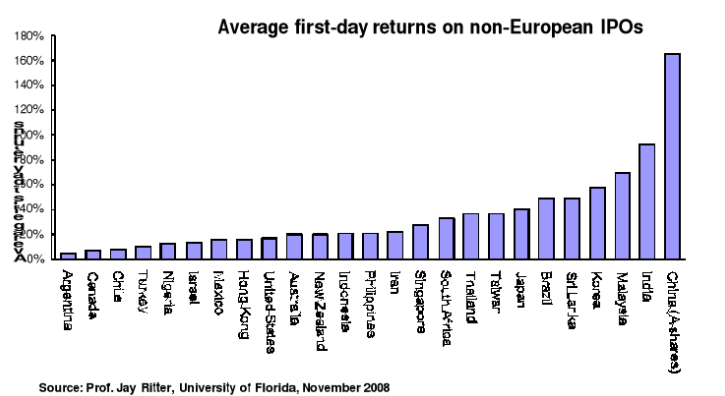
The abnormal returns for IPOs on the first day of trading is another rejection of the efficient market hypothesis and a number of explanations have been put forward for its existence.
Some authors argue that issuers voluntarily leave money on the table in order to create a nice start and good feeling among new investors in the stock and therefore allowing issuers to have more successful Seasoned Equity Offerings in the future.
Others argue that IPO underpricing can act as risk compensation for the underwriter. One other study found that banks can lose IPO market share if they underprice or overprice too much (Dunbar).
To go alongside this anomaly, there is also evidence that IPOs go on to perform worse than the market overall. So it seems IPOs typically return above average returns on the first day of trading but then go on to underperform.
In analysis of US IPOs between 1970-2010 Ritter found that equal weighted returns for IPOs were -4.8% in the first year, -8.1% in the second year and -3.3% over five years. This is well under benchmark returns.
Whatever the explanations, there do seem to be anomalies persistent in IPOs that could be available for the average investor to take advantage of.
Strategy:
More research may be needed but the general strategy is to go long IPO stocks on their first trading day. You can also short IPO stocks to capture underperformance in subsequent years.
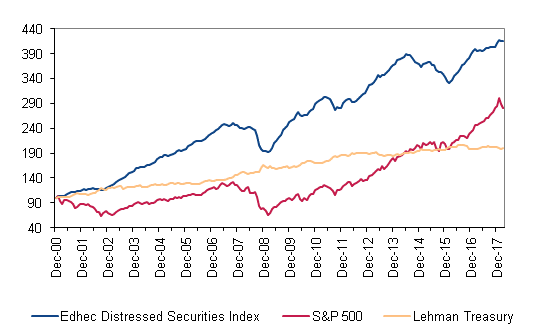
16. Distressed Securities Effect
Investing in distressed securities involves a bet that a company experiencing severe financial difficulties is essentially not as distressed as the market believes.
When a company undergoes severe hardship and becomes distressed, many investors react by selling shares and this can drive the stock price below fundamental levels.
Distressed companies can therefore be attractive to opportunistic traders looking for a bargain.
Furthermore, there are different forms of bankruptcy which can help the distressed investor.
Chapter 7 bankruptcy will involve liquidation of assets which means investors could still get a payout.
Meanwhile, under a Chapter 11 bankruptcy, the company is given permission to continue trading and reorganise which could lead to significant improvement down the road.
The following chart from Barclay Hedge shows how the Edhec Distressed Securities Index has outperformed the S&P 500 since 2000:
Strategy:
The distressed securities anomaly holds that some distressed securities become undervalued through forced selling and investor psychology.
To really succeed you need to understand balance sheets and the logistics of distressed companies.
Ideally, you should have experience of picking companies that could offer a return after liquidation of assets or after a company reorganisation.
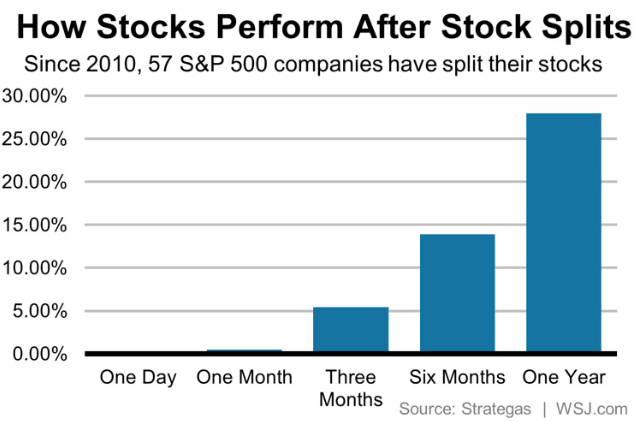
17. Stock Splits Effect
There is some evidence that companies that undertake stock splits go on to outperform the market while those that undertake reverse stock splits underperform.
The rationale behind this is that when a company splits its stock it’s often because of strong share price performance.
Usually the company splits the stock to bring the share price down and make it more affordable for investors to purchase blocks of shares. Therefore, the stock split effect is tied in to the momentum anomaly.
There is also evidence from Kalay (2014) that stock splits cause analysts to revise earnings forecasts by around 2.2-2.5% which could be another component of the excess returns.
On the flipside, reverse stock splits are more associated with negative returns.
In a sample of 143 reverse stock splits in US micro cap stocks between 2008-2016 I found an average return of -5% over the 50 days after the reverse split.
Here, the explanation is that reverse stock splits are typically implemented in poorly performing stocks.
Such companies typically implement the reverse split not as a sign of quality but because they need to trade over a certain price level to maintain exchange listing requirements.
Strategy:
You can implement a portfolio that consists of going long stocks after stock splits and going short stocks after reverse stock splits. Short trades must be managed closely but long trades can be held for up to 50 days.
18. Insider Trading Anomaly
Trading off inside information can be illegal but directors are allowed to purchase and sell shares in their companies provided they do so in a timely manner and disclose their transactions with the SEC.
It would make sense that company directors are best placed to evaluate the value of their businesses so the insider trading anomaly has been a fruitful line of inquiry for many researchers over the years.
In 1976, a paper from Finnerty concluded that increased insider purchases led to excess returns of 4.6% in the first six months while insider sales led to excess returns of -2.4%.
In more recent research from Jeng, the authors found that sales did not produce any meaningful results but insider purchases led to annual excess returns of as much as 11.2% over the S&P 500.
However, subsequent research from the Handbook of Equity Anomalies used the same methodology and produced annual returns that were nearly 7% lower between 1978-2005.
Nevertheless, the anomaly still shows grounds for development particularly in smaller cap stocks that are out of the realm of big firms.
In one study from the same book mentioned above, small cap stocks that had seen intensive insider purchases produced excess returns of around 5% in the first month, with most of those coming in the first 10 days. This is illustrated in the following chart taken from the book:
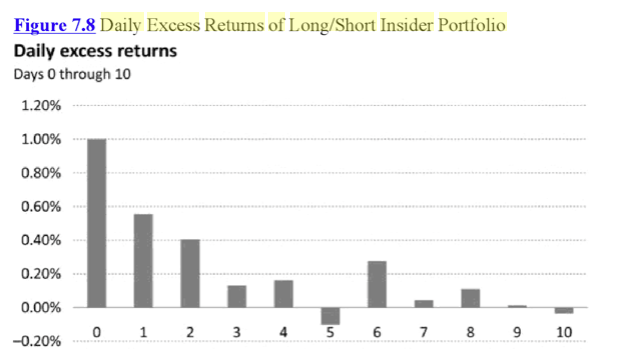
Strategy:
There are a number of online resources you can use to track insider trading such as Insider Monkey and SEC filings.
You can then go long small cap stocks with strong insider purchases. You need to be quick as most of the return comes in the first few days.
19. Accruals Anomaly
An accrual is an accounting term that refers to the non-cash component of company earnings.
The concept behind this anomaly is that a company with low levels of accruals in their earnings has more real cash flow coming in and therefore more certain earnings.
A company with high levels of accruals, on the other hand, has less cash-related earnings and may therefore have less certain earnings.
The logic of the accrual anomaly is that most investors fail to account for the accrual component in earnings releases and therefore stocks with lower levels of accruals in their earnings become undervalued.
The Accruals anomaly is quite a robust anomaly with a lot of research behind it and it seems to make rational sense.
According to data from Quantpedia, the accrual anomaly can be used to pursue annual returns of around 7.5% more than the market and with lower volatility.
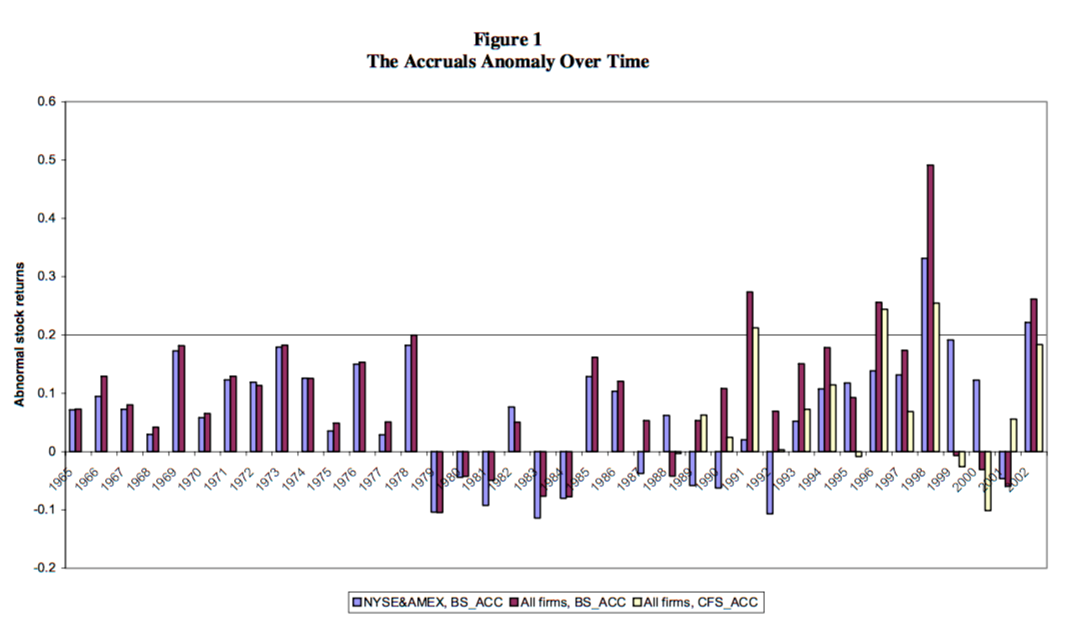
The following chart taken from a paper called Persistence of the Accruals Anomaly shows the abnormal returns associated with the anomaly going back to 1965:
As with many of the anomalies on this page, the accruals anomaly may also be combined with other factors such as momentum. It is also shown to be effective in international markets.
Research from the same paper mentioned above also shows that a larger number of stocks in the portfolio increases the statistical significance of the effect. (In other words, you can increase the probability of success with this strategy by incorporating more stocks into the portfolio):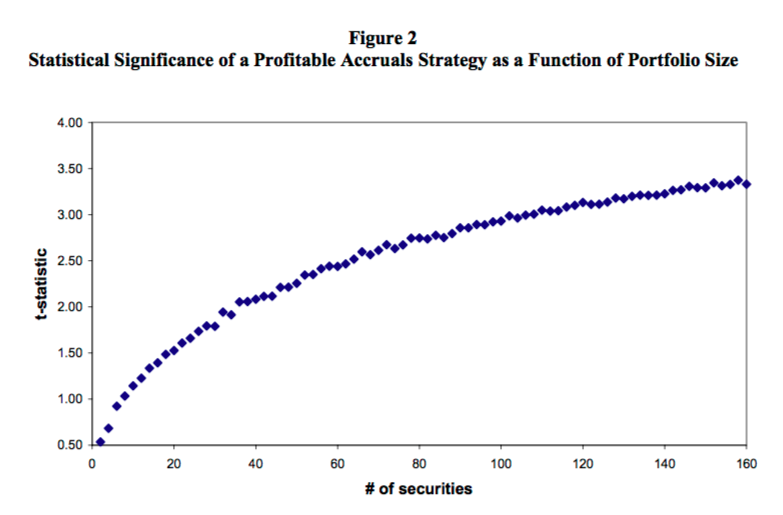 Strategy:
You can sort stocks into deciles and go long the stocks with the lowest accruals and short the stocks with the highest accruals.
Alternatively, you can use accruals as just one factor in a multi-factor investing model.
20. Buybacks And Equity Issues
The buybacks anomaly suggests that companies that buy back (repurchase) more of their own shares tend to outperform.
In one study, researchers Amini and Singal looked at 15,106 buyback announcements between 1994 and 2015. They found that companies that repurchased shares shortly before an earnings release went on to show persistent positive raw returns of 3.31%.
The buyback anomaly also appears to make logical sense.
Company directors are best placed to know whether their company has had a good quarter therefore stock buybacks shortly before earnings releases may contain useful information for other investors to take advantage of.
The equity issuance anomaly is a similar effect and was discussed in the same paper mentioned above.
This time the researchers looked at 19,466 seasoned equity offerings (not IPOs) between 1970 – 2015 and found the opposite effect.
Shorting stocks that had recently issued new equity (SEO) prior to an earnings report was shown to produce a significant net profitable return.
The explanation is that equity issuance is a bearish signal often done to raise money in a flagging business and that this gives off information that predicts negative earnings.
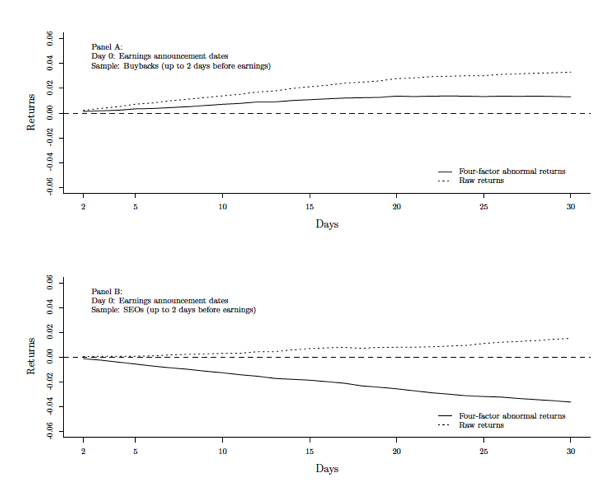
The first chart below shows how returns improve in the days following earnings in stocks that have buybacks. The second chart shows how returns fall in stocks that initiate seasoned equity offerings:
Strategy:
You should go long stocks that announce share buybacks in the two days before earnings announcements and hold for up to 15 days.
You can short stocks that announce equity offerings two days before earnings announcements and hold for up to 30 days.
Less Well Known Anomalies
21. Super Bowl Effect
There is lasting evidence that stock markets are affected by investor mood.
Investor mood can be affected by sports events and there happens to be more than one Super Bowl pattern related to the stock market.
The Super Bowl indicator, introduced in 1978 by sports writer Leonard Koppett, holds that if a team from the AFC wins the Super Bowl, the stock market will decline in the following year. While a win from the NFC will lead to a rally.
Not surprisingly, this is not a robust stock market strategy and has produced some bad trades in recent years, notably 2008 when a team from the NFC won but the stock market lost -57%.
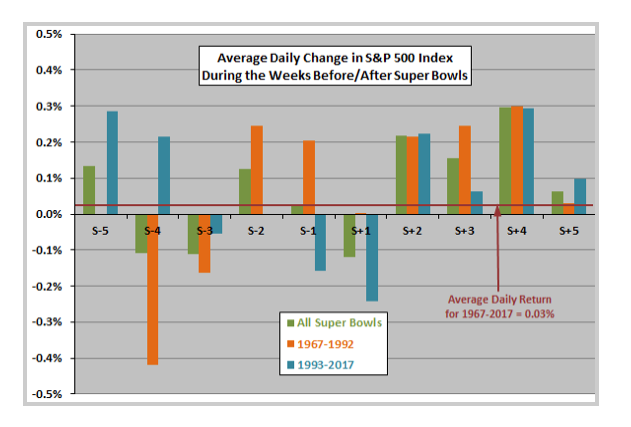
The other pattern suggests that stock markets often rally in the week directly after the Super Bowl.
CXO advisory found that from 1967 – 2017, the market rallied an average of 0.62% with a standard deviation of 2.16% in the week after the Super Bowl. This compares to an average return of 0.16% for all weeks in the sample period.
Although this does suggest some upside edge in the week after Super Bowl, the sample size is relatively small so caution is still advised.
The chart below shows that average daily returns are moderately clustered in the days +2 to +4 following the Super Bowl:
Strategy:
To take advantage of the Super Bowl anomaly, you should go long stocks or index futures on the first trading day after the game and hold the trade for five days.
22. Tax Day Trade Anomaly
The tax day trade is the tendency for the US stock market to go up on the day after tax day.
This edge was written about by Stephen Moffit who showed that if you had bought S&P 500 futures on the close of the tax day and exited the trade on the close one day later, you would have made an average gain per trade of 0.5% since 1980.
The explanation for this stock market anomaly is that many people wait until the very last minute to pay their taxes and there is then a simultaneous rush to get their money into an IRA on the final day. Brokers then end up overwhelmed and lodge a number of the trades on the next day open.
The interesting thing about this anomaly is that it doesn’t exist prior to 1980 when the rules regarding IRA contributions were changed.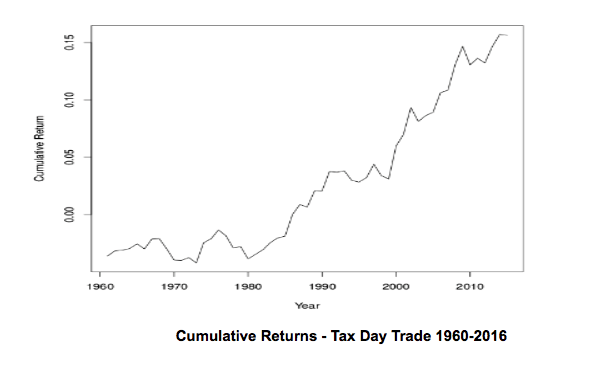 Strategy:
You can go long S&P 500 futures on the close of tax day and hold for one full trading day.
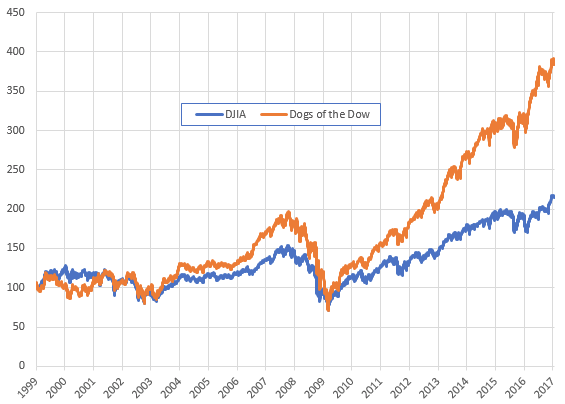
23. Dogs Of The Dow Strategy
The Dogs of the Dow strategy has been around since at least the early 90s and exists in a couple of different forms.
According to Mike O’Higgins, the strategy involves tracking the 30 stocks in the DJIA and each year selecting the 10 stocks with the highest dividend yield.
Each year the portfolio is rebalanced so that you always hold the 10 stocks with the highest yield (the dogs).
Since dividend yield often moves inversely to price, this is essentially a contrarian strategy where you are selecting some of the weakest performers from the index.
According to this analysis from Steve Auger, the Dogs of the Dow strategy has been an effective one, outpacing the Dow index by a decent margin since 1999:
Alternative strategy
Another variation of this strategy is to go long stocks that have been removed from market indexes.
For example, when the S&P 500 announces constituent changes, go long the stocks that have been removed.
These ‘dogs’ often see compulsory selling by fund managers who track the market indexes and this heavy selling leaves them technically oversold and potentially undervalued.
This anomaly has been documented in the UK market with success. Research from Jay Dahya in 2006 found that “deletions to the index are associated with a negative price response, which is fully reversed over a 120-day period after news of the removal from the index.”
Strategy:
Go long the 10 highest dividend yield stocks in the DJIA and rebalance each year.
Alternatively, track stocks that have been removed from major indices like the S&P 500 or FTSE 100 and go long after heavy selling pressure around the announcement. Hold for up to four months to capture the full reversal.
24. FOMC Drift Effect
A 2011 study commissioned by the Federal Reserve Bank of New York found that large excess returns could be found trading US equities in the run up to scheduled FOMC monetary policy meetings. This effect was shown to go back to 1980 and has increased over time.
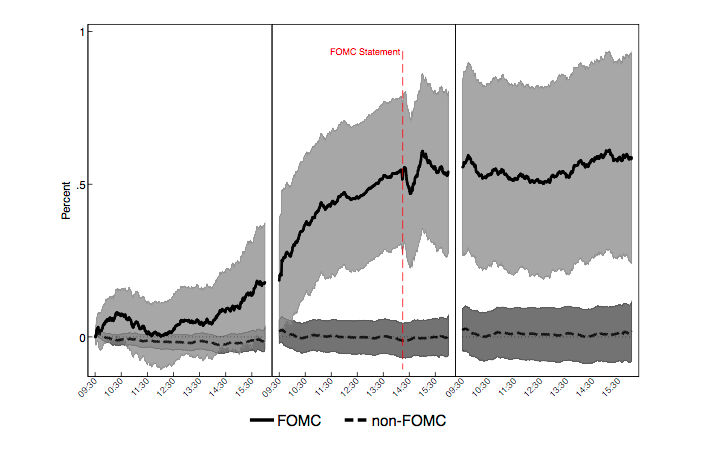
The paper, which won first place in the 2015 Amundi Pioneer Prize, shows how US stock indices generally drift higher in anticipation of FOMC meetings.
Since 1994, the S&P 500 index has gained an average of 49 basis points in the 24 hours before scheduled FOMC meetings with a high statistical significance and high Sharpe ratio.
The FOMC drift effect is shown to be robust across other international indices but no effect was found in Treasuries.
Authors also found that the drift is stronger when the slope of the yield curve is low and the VIX is higher.
The following graphic is taken from the paper. It shows clearly how stock returns have gravitated upwards on FOMC days as compared to non-FOMC days. The grey ‘clouds’ in the diagram represent confidence bands:
Explanation
FOMC drift seems to contradict the efficient market hypothesis. But it’s easy to form a rational explanation for this anomaly.
Since a primary goal of the Federal Reserve is to maintain market stability, FOMC policy announcements often act to suppress market volatility. They seek to give assurance to market participants. In recent years there has also been a trend of lower interest rates and accommodative monetary policy.
Traders and investors anticipate this soothing presence from the Federal Reserve particularly during volatile periods.
Short sellers may also refrain from entering short positions in the run up to FOMC announcements. They don’t want to be short if the Fed is likely to cut rates.
A possible criticism of this anomaly is that it shows strongest performance between 1980 – 2011. This is roughly the same amount of time that interest rates have been declining in the US.
It will be interesting to see how the pattern holds as interest rates rise.
Strategy:
An easy way to implement this strategy is to go long index futures in the 24 hours before FOMC meetings. You can exit trades just before the meeting gets underway.
25. Quadruple Witching Effect
Quadruple witching is the peculiar name given to the third Friday of every March, June, September and December. This is where index futures, index options, stock options and stock futures all expire.
The expiration of these contracts forces many investors to roll their positions. Essentially they sell their positions in the current month and buy it back in the next. This creates movement and volatility. Quad witching is particularly interesting for day traders.
Since quadruple witching leads to selling in the current contract it would make some sense for this to be a negative day for markets and analysis backs this up.
Research shows that shorting SPY, the S&P 500 ETF, on quadruple witching day has been a net profitable strategy. Win rate is 70% with an average profit per trade of 0.28% over the last 69 trades.
Although this is a small sample size there is some evidence of a profitable edge:
Strategy:
Short SPY on the open of quadruple witching day and exit on the same day close.
26. UK Budget Day
Investors Chronicle writer Simon Thompson has a number of interesting anomalies concerning the UK market. He talks about them in his book Trading Secrets.
One concerns the day of the year when the UK Chancellor of the Exchequer presents his budget to the House of Commons, Budget Day.
Thompson reveals that across 66 budget days since the Second World War to 2008, share prices have risen 75% of the time. Average gains in the FTSE 100 were 0.7% in 2007, 1.6% in 2008 and 1.1% in 2009.
This news has a tendency to produce a rally in stocks for up to the next 15 days particularly in small cap stocks.

Explanation
The logic of this trade is that you are betting that the chancellor doesn’t spring any nasty surprises in the budget. Instead, budget day brings some good news and tends to cause a relief rally when the new regime is announced.
Strategy:
The best way to implement this strategy is to go long the FTSE 100 on budget day if the five days prior saw an average range of no less than -0.9% on the downside and no more than 0.7% on the upside.
Volatile periods sometimes see the pattern break down according to Thompson. Trades can be held for up to 15 days after the budget is announced.
How To Think About Stock Market Anomalies
In this article I’ve documented a number of stock market strategies. Some of them have been used to great effect over the years.
Value-oriented firms have made good returns through the use of P/E ratios and book-to-market. Hedge funds such as AQR and Winton Capital have done well with momentum. William Ziemba has succeeded with seasonal patterns.
However, there’s no free lunch and just because an academic study reports a market anomaly doesn’t mean that it’s robust or that it will carry on working in the future.
Often, a market anomaly will be published that looks good on paper but cannot be executed in real market conditions. Academic research is usually not geared towards the needs of traders. Sometimes the analysis leaves out crucial details such as transaction costs or market impact.
Likewise, researchers all have different levels of skill and different methods of validating market inefficiencies.
The study by Zhang called Replicating Anomalies, looked into 447 stock market anomalies and came to the gloomy conclusion that up to 85% were statistically insignificant. They are potentially the result of data mining or backtesting bias.
Meanwhile, another study found that the profitability of market anomalies falls an average of -32% after the idea is published.
Keeping standards
It’s crucial to stay diligent when thinking implementing these edges.
Just because you read about a strategy in an academic paper doesn’t mean you should trade it. You must first do the work to understand the edge and see if holds up to your own research.
The best anomalies are those that can easily be backed up with a rational explanation. For example the behavioural biases of human investors.
Some published anomalies are easy to backtest and modify. This is something we have done a lot of in the past in our program Marwood Research.
Other anomalies are more difficult to backtest. But you can still forward test them on live data. This way you can build up a decent sample size of real market conditions.
You can also adapt and combine stock market anomalies together. The combination of value and momentum is one example. I hope, at least, that these stock market strategies have given you new ideas and inspiration.
Great article! Well done!
Thankyou!
These are all good. Except the days of the week effect. Specifically Mondays. It’s actually the opposite now. Monday’s are usually an up day.
OK!
How about September effect, October effect and Halloween Strategy? Sc Investopedia