
I started writing this post last week.
The idea was to run a large-scale optimization to see which profit targets and stop losses work best when trading US stocks (similar to the article I wrote on trailing stops).
I wanted to find out if it’s better to use a tight profit target or a loose one. Is it better to use a 5% stop loss or a 50% stop loss?
Using historical data from Norgate, I tested 225 different combinations of stop losses and profit targets on more than 11,000 US stocks back to July 1990 using a random entry signal. This analysis resulted in over 300,000 trades and threw up some quite surprising answers.
The following table shows a summary of the optimization results according to return-to-risk. The orange-red zones indicate areas of good performance and the blue-green zones show weaker performance:
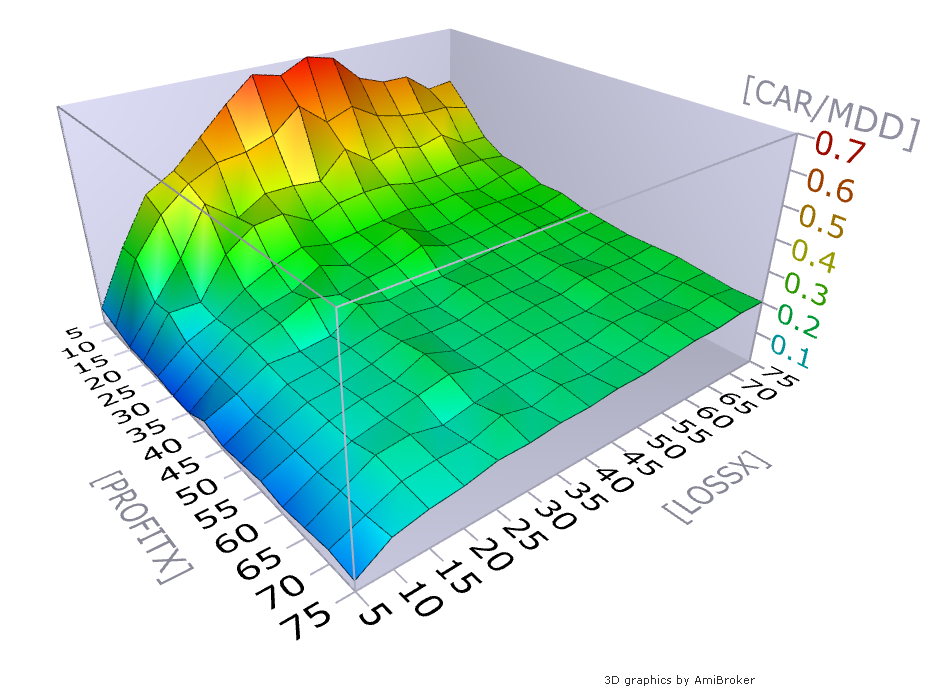
As you can see from this analysis, the best combination was a 5% profit target and 45% stop loss which was quite a surprising answer since it contradicts the typical advice to cut losses short and hold on to winners.
I then went further and created a simple portfolio system utilizing a random entry, a 5% PT and 45% SL and produced a stunning annualized return of 21% with a drawdown of -41%.
It was then that I realised the error of my ways.
What’s Happening Here?
I had coded the system to initiate trades at intraday prices but forgotten about the problems of using end-of-day data to test intraday exits.
Because the EOD data is back-adjusted for splits and dividends it’s hard to trust the intraday price fills as reported by the backtester.
For example, at the end of 2018, the system entered a trade in AGNC.
In March 2019, AGNC had a closing price of 18 but the adjusted close was 15.03555. The intraday high was 15.08566 and my profit target got executed according to the backtester at a price level of 15.06896.
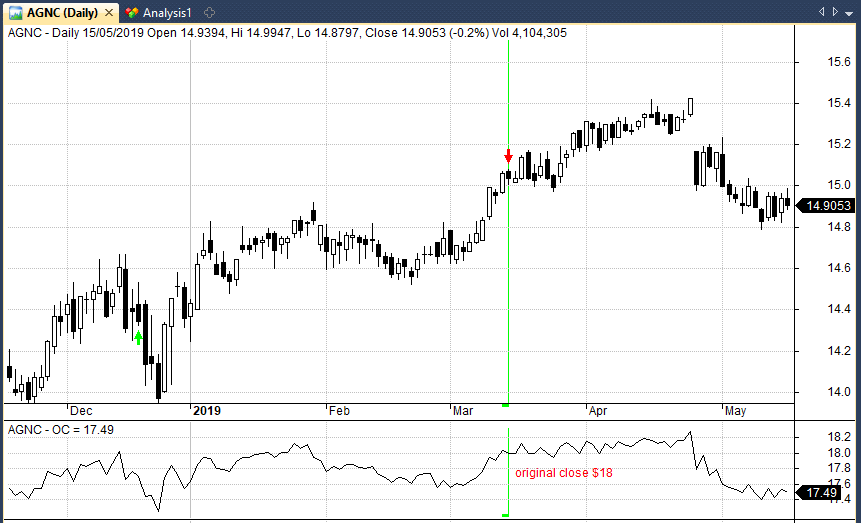
It’s hard to say whether or not this profit target would have been filled in real-time since the stock never traded at this price level – not with all those decimal points. There is also the issue of how much slippage (above the 0.1% transaction cost) would have affected the true exit price
Overall, the excellent results from the portfolio simulation cannot be trusted since there were multiple trades filled near their intraday highs. My instinct and previous experience tells me that the 5% profit target is probably not so good after all.
Potential Solutions
There are some solutions to this backtesting problem but none of them are particularly straightforward.
- We could use unadjusted data so that we trade only at price levels that were true in the past. The problem here is that we introduce the issue of big price gaps in the data from stock splits and dividends that will distort returns.
- We could use higher frequency data such as 1-minute data or tick data and include a method to more accurately estimate slippage. This is a good option and might best be done on a platform like Quantopian. Doing this on a vast universe of unbiased US stocks would take some time.
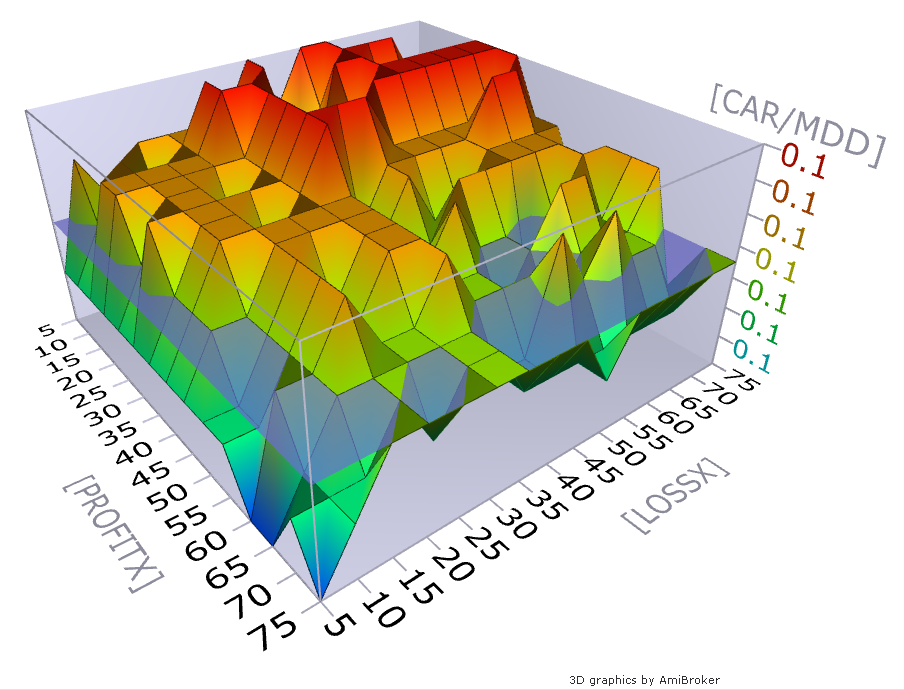
- We could delay the exit so that it takes place on the close or on the next bar open (data points we can have more confidence in). However, this kind of takes away the point of using stops in the first place. In fact, delaying the entry to the next bar open results in the optimal parameters changing from a 5% profit target to a 35% profit target and a 45% stop loss to a 70% stop loss. To compound matters, these new settings produce a return-to-risk score of only 0.13 which is not good enough to trade.
Where To Place Stops
We could spend more time exploring the best combination of profit target and stop loss to use but the truth is that there will be no holy grail. Trust me, I’ve looked into this before and the results were never good.
In the end, the placement of a stop loss or profit target depends on risk tolerance, trade rationale and the type of strategy being implemented.
A scalper can get away with using a tight stop loss and small profit target since he is watching the market intensely and looking for just a couple of ticks.
A contrarian investor, on the other hand, requires a wide stop loss and even wider profit target to make the strategy worthwhile.
A stop loss should only be used as a means to manage risk. If a stop loss is implemented, even though the trade rationale is still intact, then there has been a mistake in either the sizing of the trade or the timing of the entry.
Likewise, the profit target should only be used to lock in gains if an investor believes his original thesis has been proved correct or if there has been a change in that trade thesis.
Final Thoughts
When I started this post I had the intention of finding a definitive answer as to what profit target or stop loss to use when trading stocks. I was excited to find that a simple random entry worked well with a tight profit target around 5% and a loose stop loss around 50%.
However, I soon realized that the answer is not as straightforward as it sounds and analyzing profit targets and stop losses intraday is more complicated than expected. Slippage is something that is not easily modelled particularly on a large number of securities and delaying the trade exit leads to unsatisfactory results.
Unfortunately, there are many studies out there that do not take into account these issues of backtesting intraday entries on end-of-day data. This can lead to unrealistic results and undue confidence.
I realize this article is a bit of an anti-climax. It would be wonderful if there was a perfect stop loss and perfect profit target out there to use. But it simply cannot be the case. Nevertheless, hopefully you learnt something about backtesting.
Notes
The data used for this analysis comes from Norgate Data. Stock charts created in Amibroker.