
After a big stock market move on a Monday you will often hear traders talk about turnaround Tuesday.
The concept is very simple. When stock markets start the week in a big way, they will often settle down on Tuesday and put in a decent reversal.
Looking at the data, we find that there is a small edge in turnaround Tuesday on the S&P 500. We also find that this edge is best played out during volatile periods.
Setting Up The Test
To test the turnaround Tuesday strategy we will be using historical data from Norgate for the S&P 500 SPY ETF. We will include commissions of $0.01 per share and test a period from 1/2000 – 4/2020.
We are going to test a number of different variations. We will be entering on the Tuesday open after a big move on Monday (and exiting on Tuesday close). We will also test entering on the Monday close, exiting Tuesday close.
The full test results are shown below:
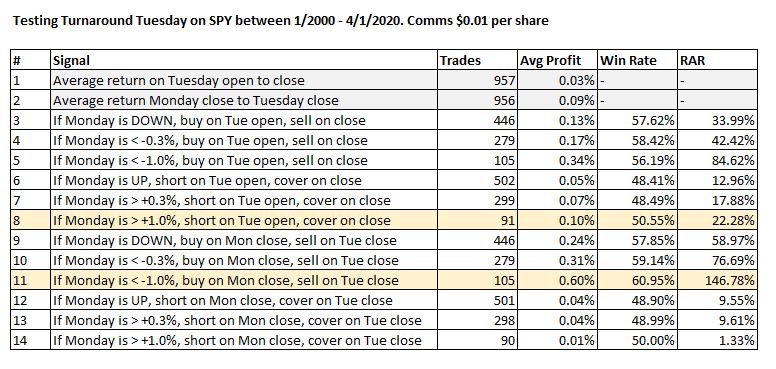
As you can see from the table, we got some quite interesting results from the turnaround Tuesday test which I will try and summarize below.
1. The first thing to note is that the average return on a Tuesday was only 0.03% and the average return from Monday close to Tuesday close was only 0.09%.
Several of our tests beat this return (by a decent margin) which indicates a possible edge may be present.
2. The best return came from buying SPY on the close of Monday after a down day of more than -1.0% and then exiting on the close on Tuesday. We got an average profit of 0.60%, a win rate of 60.95% and a risk-adjusted return of 146.78%.
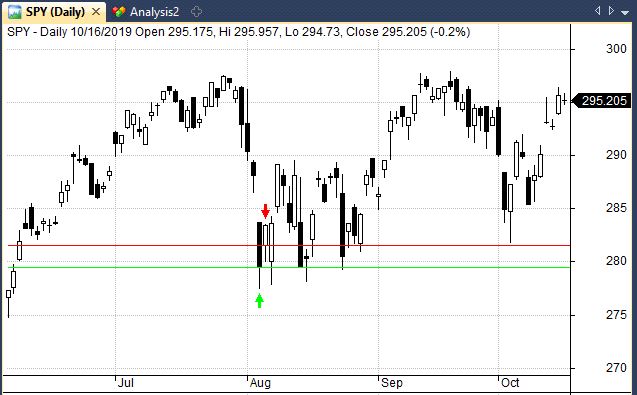
The following chart shows an example of this trade setup. SPY dropped more than 1% on Monday 5th August 2019 so we went long on the Monday close (green arrow) and exited at the close on Tuesday (red arrow) for a profit of 1.40%.
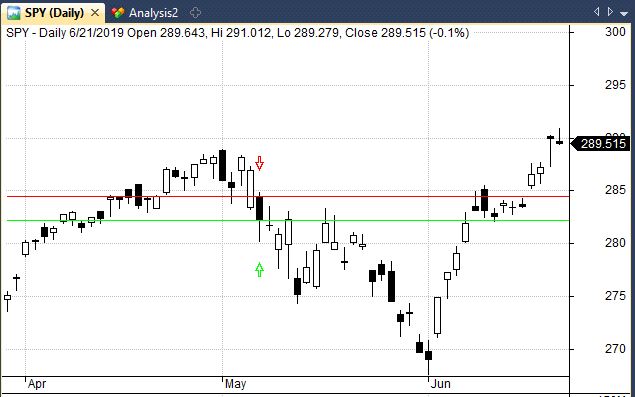
3. The best short return came from shorting SPY on Tuesday open after an up Monday of more than +1.0% (and exiting on Tuesday close). This produced an average profit of 0.10% and a risk-adjusted return of 22.28%.
The following chart shows an example from 7/5/2019:
4. Overall, the data suggests that it’s better to buy the turnaround on the Monday close to take advantage of the rebound overnight and the extra holding length. Meanwhile short trades perform better with no overnight hold.
Our findings are consistent enough to suggest that turnaround Tuesday may in fact have some edge.
Long And Short Portfolio Test
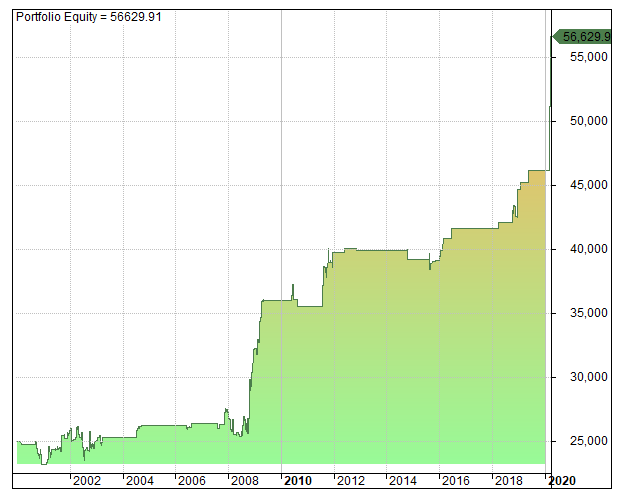
Although it is useful to see the data presented in a table it is also necessary to view the results with an equity curve so we can be sure that the profits did not come in a single cluster.
Therefore, in the next test we will combine rules #9 and #14 from the table above in a long/short portfolio simulation:
We will buy SPY on Monday close after a down day – exiting on Tuesday close – and we will short SPY on Monday close after a +1.0% up day.
We will use a starting position size of $25,000, commissions of $0.01 per share and no margin. Our results are summarized below:
- Trades: 536
- CAR: 4.72%
- MDD: -12.96%
- Win Rate: 55.97%
- RAR: 44.98%
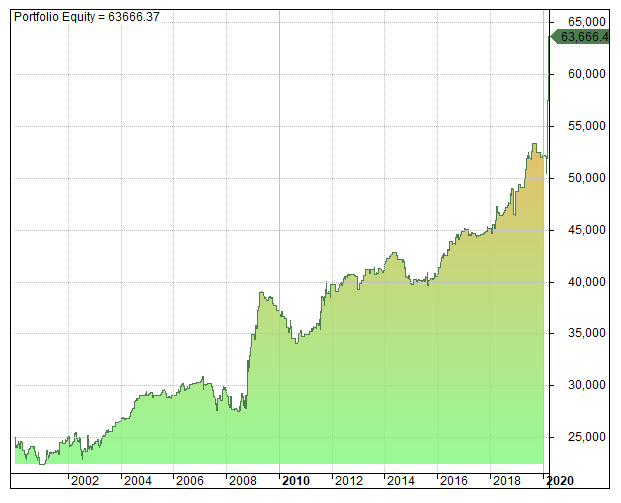
The strategy produced an annualised return of 4.72% with a maximum drawdown of -12.96%.
This compares favourably with the buy and hold return of 4.59% with a max drawdown of -55% giving us a risk-adjusted return of 44.98%.
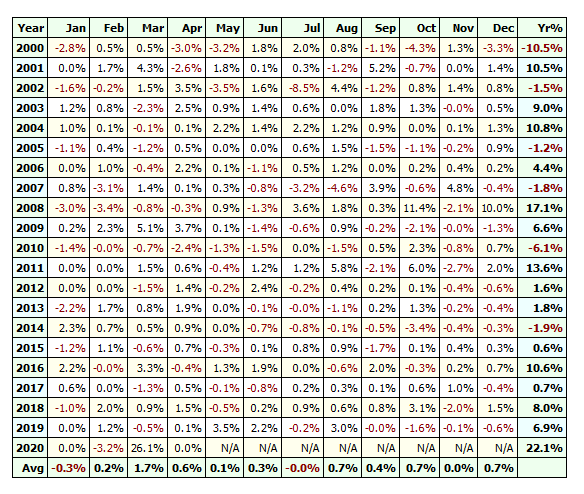
The strategy has been profitable over the last 20 years and the equity curve confirms that profits have been relatively consistent over the test period.
In fact, the profit table reveals that performance tends to be best in volatile years like 2008, 2011 and 2020.
Turnaround Tuesday Bear Markets Only
As mentioned above, the results suggest that the strategy performs best during volatile periods.
Therefore, in this final test we will run the same strategy as above but we will confine our test period to days when the S&P 500 is trading below it’s 200-day moving average only.
Following is a summary of results:
- Trades: 206
- CAR: 4.12%
- MDD: -10.24%
- Win Rate: 58.74%
- RAR: 102.08%
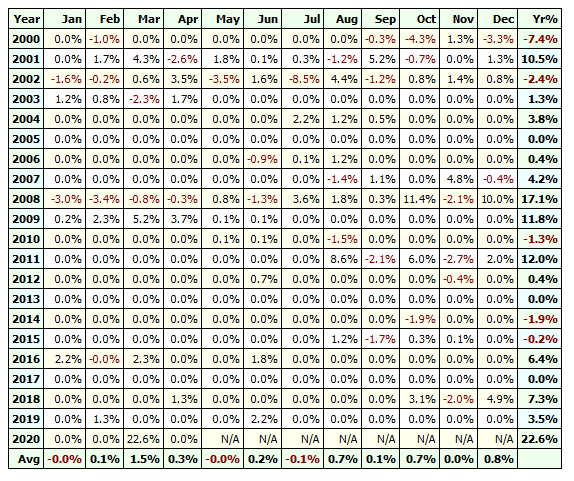
Although our sample size and annual return has gone down we have also recorded a lower drawdown and this has improved our risk-adjusted return to 102.08%.
That’s not a bad result and could be a good diversifier during volatile markets.
Final Thoughts
In this article we looked at the performance of turnaround Tuesday which is an old school trading pattern. We found a small edge in the S&P 500 ETF which was relatively consistent and shown to be stronger in bear markets.
This edge is worth looking into and could be further enhanced through the use of leverage or by trading futures or CFDs. We could also test different bear market definitions and look at other markets.
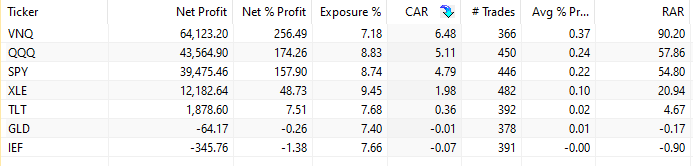
Some preliminary testing found that the turnaround Tuesday strategy was also profitable on QQQ and VNQ but not GLD or IEF.
This is a simple edge that could be worth looking into further and then combining with other small edges or strategies. It seems that old trading wisdom does have some truth to it after all.
Nice artice! Thanks for sharing
Any time.
Please change my email from the Gmail to elliseconomics@yahoo.com
FYI I have been working on an end of day candle to predict tomorrows up or down moves. I have used my study of candles, which started with your first post on them back some time ago, to devise a good set up that allows a fix to options trades. Again you are a very unique force in training.
Thanks for all you do; your friend in the desert where the heat kills the virus and some folks.
God Bless and take good care and be well.
ellis
Cool idea, thank you for sharing!
Maybe the VIX could be used as the volatility filter instead of the SMA 200.
Yes, I was thinking the same thing.
Hi Joe. I am checking SPY price, but based on yahoo finance, I do not see any monday in June or July 2019, meeting the 1% criteria. How is it then that the performance table shows activity in June and July of 19?
Thanks for your very informative blog
Can we test if buying on close when it’s more than 1 percent and then selling on next day close.
Not just Monday.