
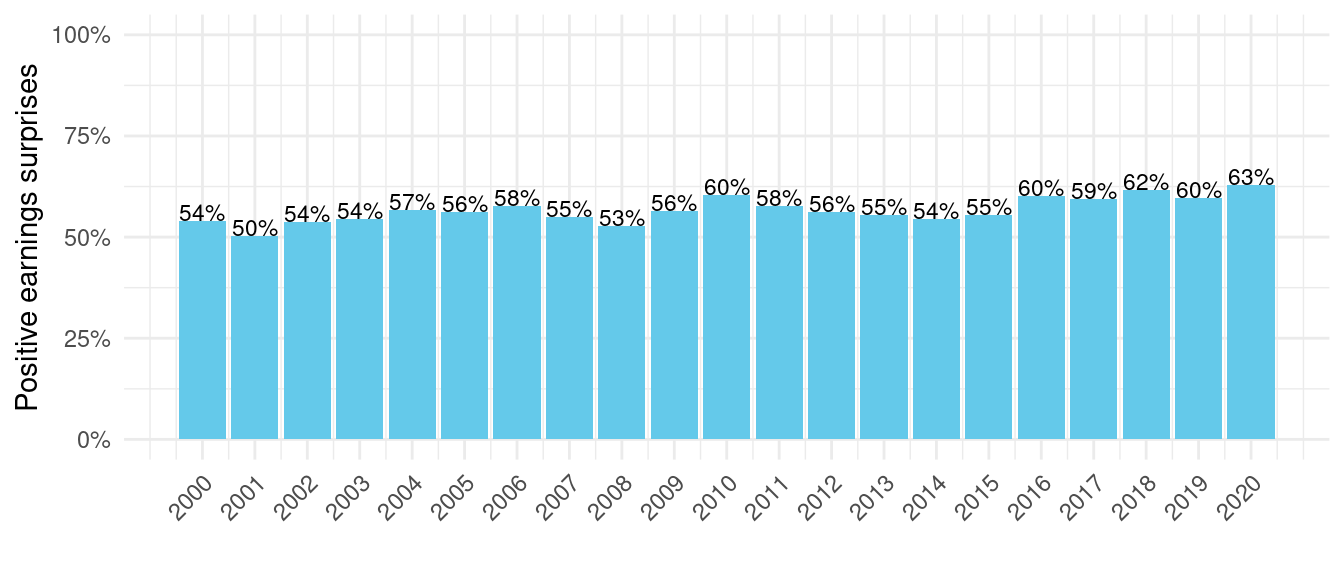
Did you know that in 2020, 63% of quarterly earnings releases beat their estimates? That’s slightly higher than the 20 year average of 58%.
Even in turbulent years like 2008, earnings surprises still tended to be positive on average.
Everyone knows the game. An analysts job is to deliver accurate estimates. Meanwhile, the CFOs of reporting companies like to slightly beat consensus estimates. An earnings beat keeps the stock price supported and brings some favorable press coverage.
However, this game is widely known. The result is that share prices often don’t move as expected on earnings. It’s not uncommon to observe a company report below estimates, yet the share price goes up (or vice versa).
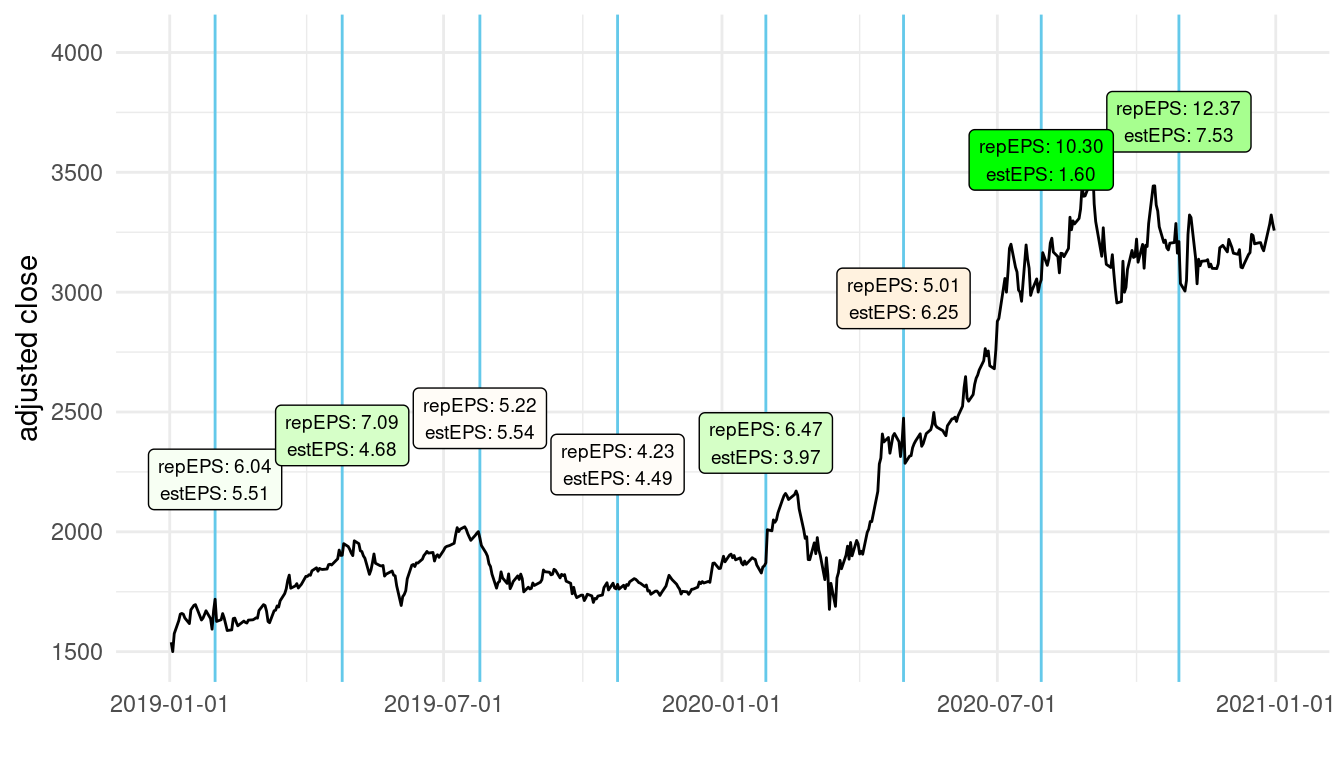
One of the many examples is Amazon. The stock fell -5.5% after 29 of October 2020, despite third quarter EPS being almost double the consensus.
For the second quarter of 2020, with an even more substantial EPS surprise ($10.30 actual vs. $1.60 estimated), the stock rose only moderately.
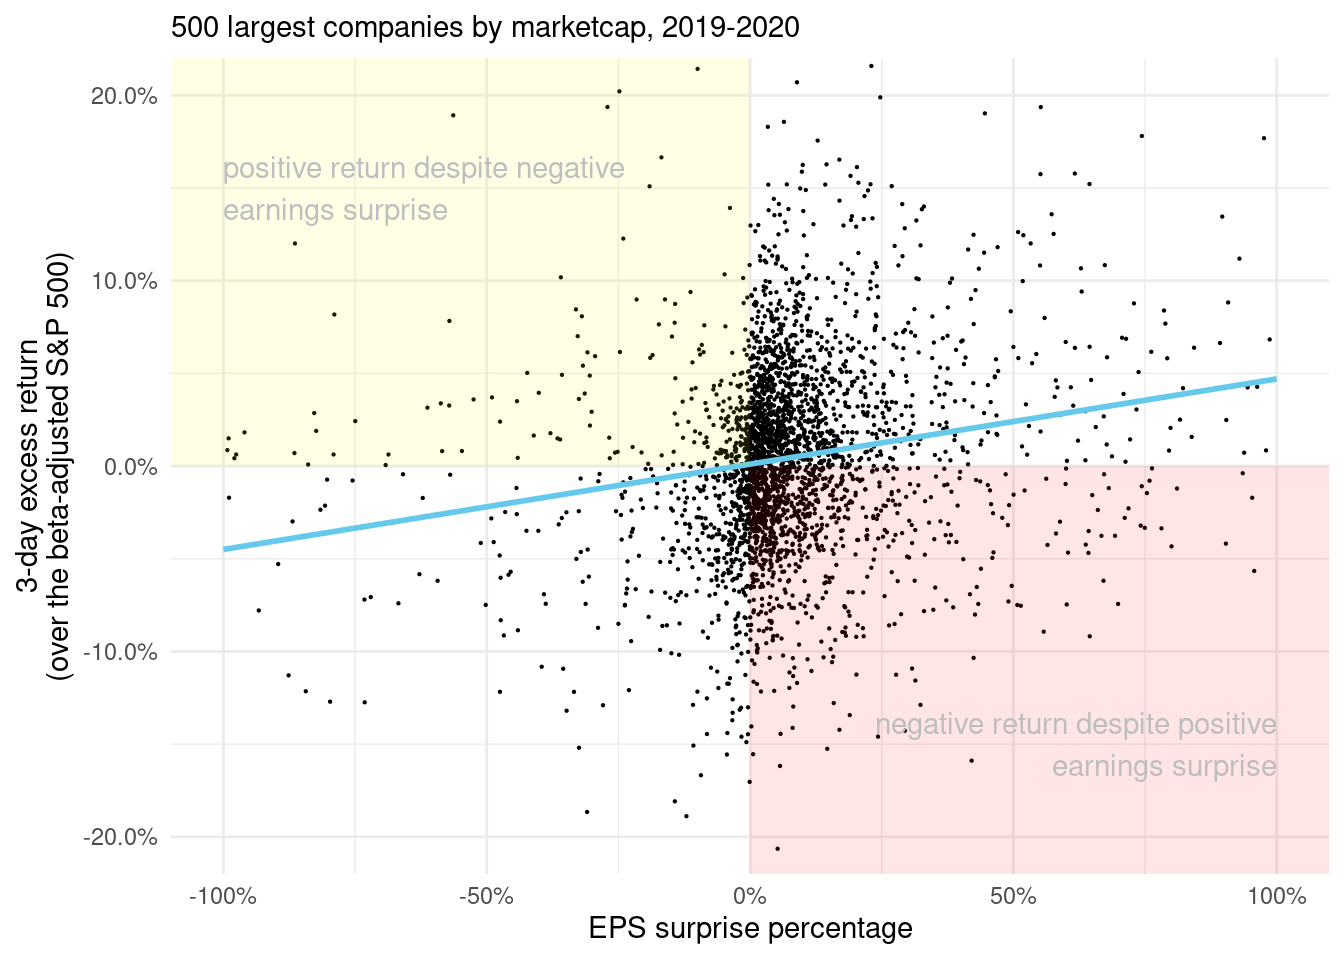
When looking at quarterly earnings surprises from 2019 and 2020, the stock return (in excess of the S&P 500 return for the same period) was negative 42% of the time even though the quarterly earnings surpassed estimates.
Conversely, in 36% of cases where negative earnings surprises were announced, the stock still rose (also relative to the adjusted S&P 500).
One of the explanations for this is that forward guidance is released together with earnings.
At the end of the day, a company’s value should reflect discounted future cash flows (or earnings), not what happened in the past. Therefore it makes sense that forward guidance factors heavily in the stock price reaction.
The overall conclusion is that stock price reaction is only weakly correlated to earnings surprise. You can see this in the high percentage of counter-directional returns on earnings dates. There is a lot of noise.
Earnings Report Trading Strategy
So far we have seen that, on average, earnings figures tend to beat estimates and that the directional stock price reaction is not very dependent on the surprise.
While you could come up with all kinds of wild trading strategies for earnings, a simple strategy is often the best.
Let’s assume the following:
- Quarterly earnings will continue on average to beat the estimates.
- Market participants dislike uncertainty and value certainty. (This is a fundamental principal of human behavior. If you were given the option between a 50/50 chance of getting either $0 or $100, or the certain option of getting $50, what would most people choose? Naturally, after an earnings release, the public knows more. This is also known as the uncertainty premium).
- Investors buy into a stock after they hear of it in the news following an earnings report, resulting in the price to go up. This is especially true for small cap stocks.1
The strategy, therefore, will be to simply buy ahead of earnings reports and sell after.
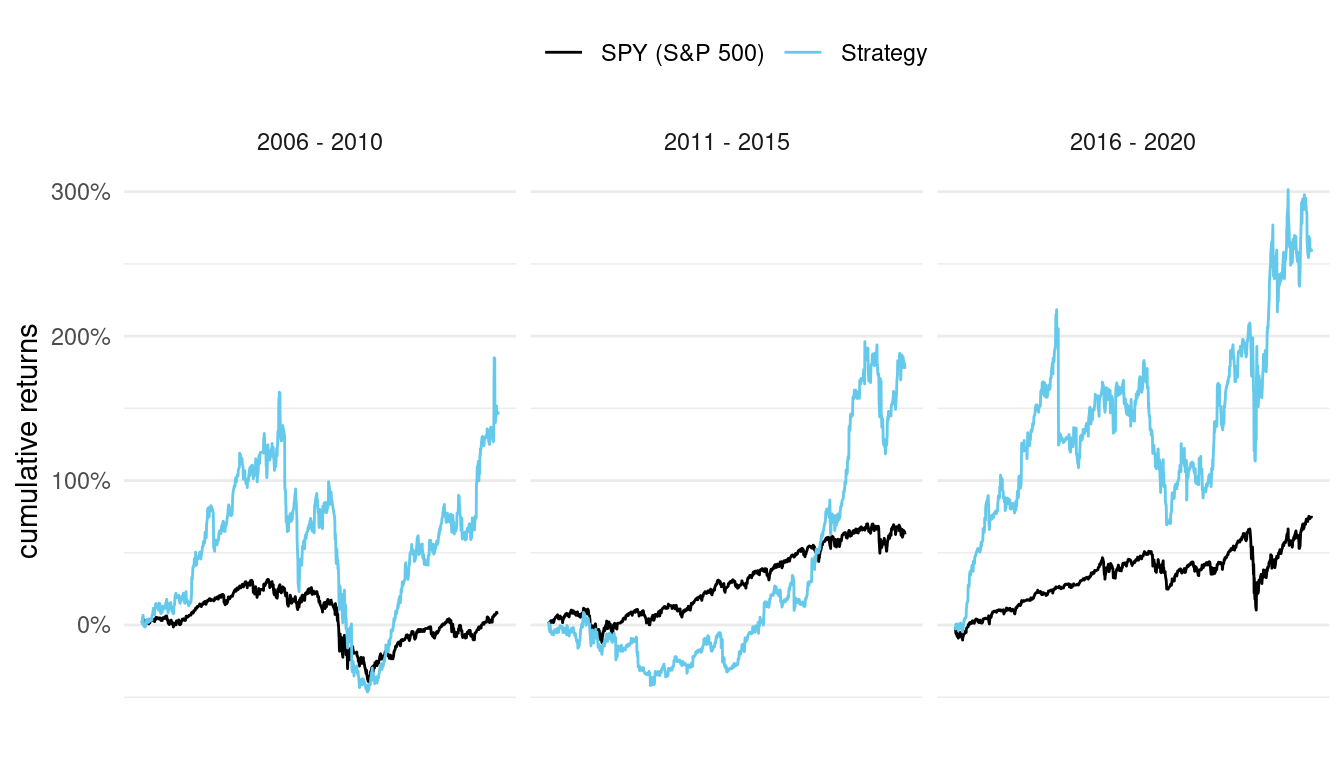
To do this, we will download historical data and earnings dates for the largest S&P 500 stocks. We will then create a strategy that buys stocks one day before earnings and sells one day after.
As you will see from the following charts, this simple strategy outperformed the S&P 500 index in 12 out of 16 years since 2005. The excess returns were quite large, particularly over more recent years.
Practical implementation would likely require fine-tuning, in particular to redefine the choices of stocks. We used the 500 largest market-cap companies but there is no reason not to try other groups.
We are also missing a number of delisted and unlisted companies which introduces some bias. However, finding the data for such companies is difficult and the bias is likely to be small.
Lastly, most trades in this strategy are placed during earnings seasons. This would require a large number of open positions. But when earnings season is not happening, other strategies can be deployed, resulting in extra alpha.
Conclusions
What we learned in a nutshell is that earnings surprises do not influence the direction of the stock price too much.
However, due to the uncertainty premium and bias for earnings to beat estimates, we can develop a strategy to invest during the earnings window.
According to our preliminary results, trading prior to the earnings release and selling shortly after generated significant excess returns.
We should do more work on this. In particular, we should find a data source that includes delisted stocks. And we should investigate other indexes and holding periods. But the results warrant further investigation.
Note: For our analysis and backtest we have used data from FMP Cloud. For the strategy backtest we buy the one day before earnings release and sell one day after. This allows us to capture the price reaction no matter if the release is in the morning (pre-markets) or evening (after-markets). At any point in time we equally distribute our holdings among all earning candidates, which of course are more during earning seasons and fewer or none out of earning season.
Your analyses are getting ever more interesting! Thank you for it.
This looks like a very good base for a strategy. Maybe if a few more criteria are added to reduce the insane drawdowns, this could be really profitable, as long as we control overfitting.
Maybe skip days where fewer than say 5 companies are reporting earnings, to smooth returns instead of over-concentrating on just of a few names on some days.
Yes could be a possibility which I didn’t think of. Drawdowns definitely need some work. Have a nice day.
Thanks!
A couple of points:
One problem with this strategy is how do you handle the huge gaps that frequently occur when earnings are released.
It would be interesting to compare this strategy to the well known post earnings announcement drift (PEAD) approach..
Although you disclose that you sourced the data from FMP Cloud there’s no mention of any other software used. It would be nice if you could elaborate a bit on that. Was it Amibroker by any chance ?
Thanks for the interesting article.
Thanks for your comment. Gaps are part and parcel of trading earnings. If position size is small then they are not a problem. Of course, this is just a preliminary analysis so a more complete trading strategy would take those further into account.
I agree, I would love to look at PEAD. Having difficulty finding the right data that is also not too expensive. We are using Amibroker/R/Excel.
Interesting that you used multiple software packages and no doubt this offers more possibilities than using Amibroker alone. It would be great if you could offer a tutorial on your approach. I for one would be very interested in learning how to extend Amibroker by using R and Excel.
Hi Brian. On my new course HTS Part Three I show how I use Amibroker, R and Excel to build trading strategies with fundamental data sources. The course is complete and will be published soon. Thank you.