• Skip to main content
  • Skip to primary sidebar
  • Skip to footer

Decoding Markets

  • Top Posts
  • Courses
  • Resources
    • Books
  • Free Class
  • Blog
You are here: Home / How to / Trading stocks with Google Trends – part 1

November 12, 2013 By Joe Marwood 1 Comment

Trading stocks with Google Trends – part 1

If you are anything like me, you probably like to keep up to date with new technology, watch for new trends and generally keep abreast of anything that might lead to profitable trading opportunities. With that in mind, last week I did a bit of research on trading stocks with Google Trends and was quite surprised at what I found.

Trading stocks with Google Trends isn’t easy

The first thing that caught my attention is that there isn’t actually a great deal of information available about using Google to trade. (Which is hardly surprising really since Google  Trends is relatively new and most search data only goes back to around 2004.)

The most interesting article I could find comes from a paper by the Nature Scientific Report entitled ‘Quantifying Trading Behaviour in Financial Markets Using Google Trends’ written by the economists Tobias Preis, Helen Susannah and  H. Eugene Stanley.

In the paper, the economists analyse Google search data for 98 different finance related search terms between 2004 to 2011 and appear to come up with a near foolproof strategy that was shown to yield a return of 326% over the time frame.

How it works

The idea behind the study is simple. The three economists took data from Google Trends and entered long or short positions whenever there was a spike in their chosen keyword. Some keywords performed better than others and some had no effect whatsoever.

The keyword ‘debt’ was the best predictor of returns

It was found that the search term ‘debt’ was the most effective in predicting market moves. Preis et al therefore used the data to enter long or short positions in the Dow Jones Industrial Average.

Whenever Google searches for the keyword ‘debt’ increased, Preis et al entered hypothetical short positions in the main index for one week. Conversely, whenever searches for ‘debt’ decreased, the economists went long for one week.

Trading in this way, the strategy was shown to make a return of 326% while a buy and hold strategy on the Dow would have made just 16%.

An example of curve fitting?

The problem with this study, in my mind, is that is a clear example of curve fitting to past data. By choosing the best keyword, the writers are using the best parameter from the hypothetical results. There is no testing on out of sample data which means they have broken one of the first rules of system optimization.

Furthermore, since we all know that the global financial crisis stemmed from a problem of bad credit, we already know that the word ‘debt’ is likely to be a big predictor of major moves.

We have all lived through the the financial crisis so we all know about those massive declines in the Dow. And as the chart below shows, it is during the crisis that most profits were made.

Quantifying trading strategies with Google

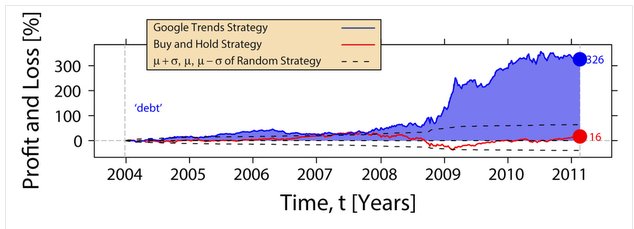
Source: Scientific Nature Report

This study suggests that going forward, using the keyword ‘debt’ will produce similar returns but I find this very unlikely.

Just as we could not know that ‘debt’ would be so paramount to financial markets between 2004-11, we will not know what search terms will be considered important over the next time periods. Shorting stocks because the word ‘debt’ is searched more frequently seems dangerous. Indeed, the term has spiked twice since 2011, yet the Dow Jones has gone on to record highs.

Conclusion

Overall, I think we can thank the authors for this study as it has given us some interesting insights. However, to trade using this strategy could be deeply flawed. The only way to tell is by running it over clean, future data. The future is never known and I doubt that this strategy will stand up over time.

In part two I will look at more ways of incorporating Google Trends into stock trading systems.


Thank You For Reading

joe marwood profile pictureJoe Marwood is an independent trader and the founder of Decoding Markets. He worked as a professional futures trader and has a passion for investing and building mechanical trading strategies. If you are interested in more quantitative trading strategies, investing ideas and tutorials make sure to check out our program Marwood Research.


Disclaimer

This post expresses the opinions of the writer and is for information, entertainment purposes only. Joe Marwood is not a registered financial advisor or certified analyst. The reader agrees to assume all risk resulting from the application of any of the information provided. Past performance is not a reliable indicator of future returns and financial trading is full of risk. Please read the Full disclaimer.

Filed Under: How to, Stocks, Strategies/ Systems Tagged With: finance, google trends, investing, stocks, trading, trends

Recommended Educational Resources:


  • Discover New Trading Strategies
  • Learn Japanese Candlesticks (Free)
  • Mental Models For Trading (Free)
  • Indicators For Amibroker (Free)
  • Tools For Options Traders (Free)
  • Historical Data For 8000 Stocks (Free)

Reader Interactions

Trackbacks

  1. 10 Free Trading Tools For Online Stock Trading says:
    October 30, 2014 at 8:18 pm

    […] actually think the study is flawed (and you can read more about that here) nevertheless I think Google trends can be useful for identifying new markets or […]

    Reply

Leave a Reply Cancel reply

Your email address will not be published.

Primary Sidebar

Access Marwood Research image

Popular

Which Trailing Stop Is The Best?

Stock screen image

20 Traps All Traders And Investors Must Avoid

technical analysis for stocks

Technical Analysis For Stocks Essential Guide

Backtesting a finviz stock screen

Good Results From Backtesting A FINVIZ Stock Screen

does technical analysis work? one in 5 hedge funds use it

Does Technical Analysis Work? Evidence From The Social Sciences

trade example in the us ten year

Shorting The US Ten Year With ATR – A Simple System That Shows A Profitable Edge

The Truth About Intraday Momentum

Testing The RSI Model From The Quantitative Technical Analysis Book By Howard Bandy

Search

Recommended Resources

  • Discover New Trading Strategies
  • Learn Japanese Candlesticks (Free)
  • Mental Models For Trading (Free)
  • Indicators For Amibroker (Free)
  • Tools For Options Traders (Free)
  • Hist. Data For 8000 Stocks (Free)

Financial Disclaimer

Financial trading is risky and you can lose money. Joe Marwood is not a registered investment advisor and nothing on this site is to be regarded as personalized investment advice. Past performance is not indicative of future results. Data errors and mistakes do occur. Please see the full disclaimer.

Footer

About The Author

Joe Marwood is an independent trader and investor specialising in financial market analysis and trading systems. He worked as a professional futures trader for a trading firm in London and has a passion for building mechanical trading strategies. He has been in the market since 2008 and working with Amibroker since 2011.

Joe Marwood Profile PIc

Recent Posts

  • Trend Following With ETFs and Large Cap Stocks
  • Should You Trade This Earnings Pullback Strategy?
  • Simple Algo Trading With Alpaca And Streak
  • Is Value Investing Dead? Dissecting The Value Investing Narrative
  • How To Screen For Stocks With Norgate Data
  • Do Stocks Have A Floor?
  • What Trading Signals Work Best For Long-Term Investors?
  • Is The Biden Trade Priced In?

Search

Privacy policy | Contact | Disclaimer | All Rights reserved. JB Marwood.