
In a previous article we looked at the effects of introducing price to earnings data to a mean reversion strategy.
Although the effects were quite small, we found that we could improve a simple RSI strategy by avoiding stocks with negative PE ratios.
We also found that stocks with PE ratios over 15 produced higher win rates and higher Sharpe ratios.
In this article we will conduct a similar analysis but this time our focus will be on trend following strategies.
Baseline Trend Following Strategy
To analyse the effect of price to earnings data we will start with a baseline trend following strategy that buys large cap stocks from the S&P 100.
We will then compare the results of adding rules based on price to earnings data.
The full rules of the baseline strategy can be described as follows:
- Buy = New 200-Day High (Close)
- Sell = 10% Trailing Stop
- Timeframe = Daily
- Universe = S&P 100 (dividend adjusted and including delisted symbols*)
- Starting Capital = $100,000
- Portfolio Size = 10
- Position Size = 10% (equal weight/no margin)
- Ranking = ROC(200) highest preferred
- Commissions = $0.01 per share
- Execution = All trades placed on next bar open
- Test Period = 1/2007 – 1/2019
This is a very simple trend strategy that buys new 200-day highs but it is shown to be profitable with an annualised return of roughly 7% and a Sharpe ratio of 0.18:
- # Trades: 298
- CAR: 6.97
- RAR: 8.33
- WR: 46.98
- MDD: -22.95
- CAR/MDD: 0.3
- Sharpe: 0.18
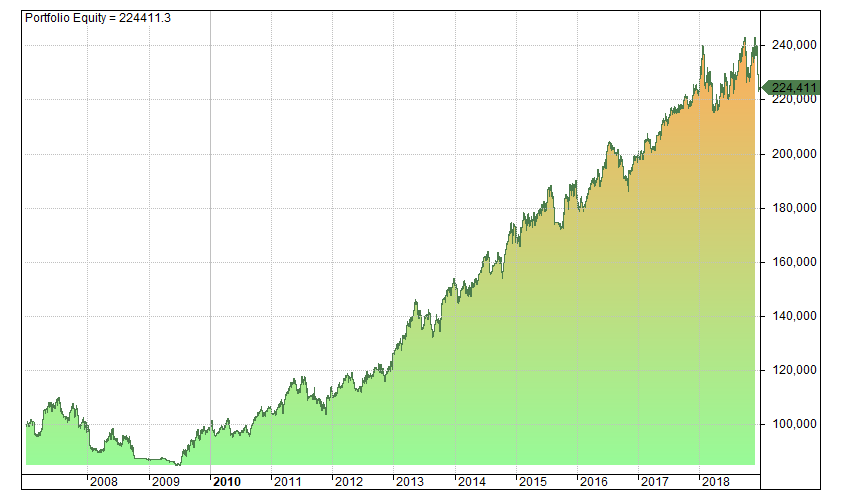
This return may not seem like much, however, it is ahead of buy and hold on a risk-adjusted basis and as we saw in our Jesse Livermore tutorial, the return can be greatly enhanced with some simple pyramiding.
*See notes about data below.
Trade Example
Next is a trade example in LLY:
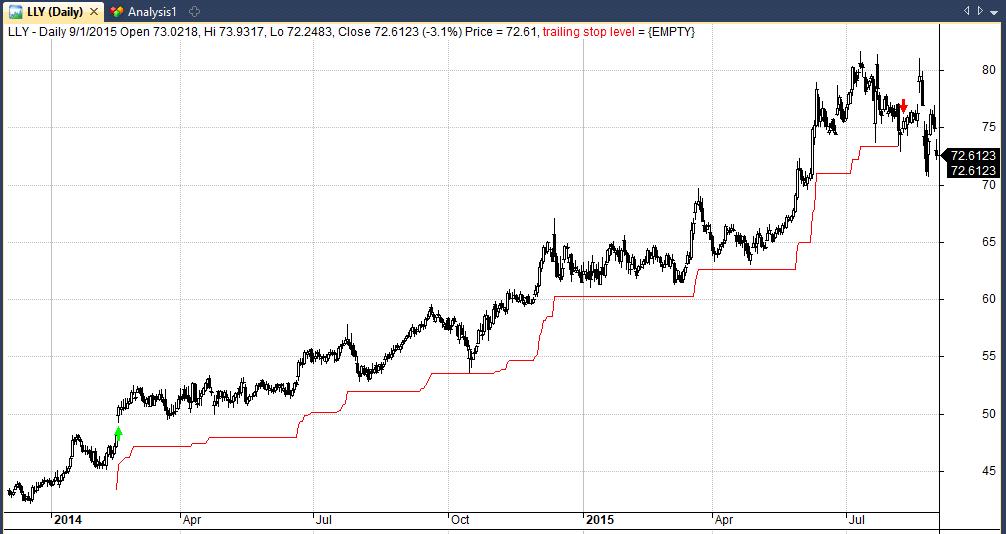
You can see that LLY hits a new 200-day high on the 18th February 2014. We therefore go long on the next open with a 10% position size.
The stock keeps moving higher until we are taken out by a 10% trailing stop on the 9th August 2015. The total profit after commissions is 50.03%.
Adding P/E and EV/EBITDA Rules
Now we have seen the results of this baseline strategy we can start adding some fundamental rules to this system and see if they have any positive effect.
For this analysis we are going to run six additional tests as follows:
- Test 1: Baseline rules AND P/E Ratio > 0
- Test 2: Baseline rules AND P/E Ratio > 15
- Test 3: Baseline rules AND P/E Ratio > 0 AND < 15
- Test 4: Baseline rules AND EV/EBITDA > 0
- Test 5: Baseline rules AND EV/EBITDA > 15
- Test 6: Baseline rules AND EV/EBITDA > 0 AND < 15
As you can see, we are testing the inclusion of two valuation ratios: the P/E ratio and the EV/EBITDA ratio.
For example, let’s say we are running test five and we get a new 200-day high in AAPL. Well, we will only take that signal if the EV/EBITDA ratio is also over 15.
EV/EBITDA is often seen as a more sophisticated version of P/E. I also prefer it to P/E so it should be interesting to see our results.
A Note About The Data
For this analysis we will be using Amibroker with end of day price data from Norgate and fundamental earnings data from Intrinio. This data is pulled into Amibroker using an API script.
The data includes delisted stocks, however, there are approximately 16 symbols (out of 224) of which I was unable to source complete fundamental data for. Symbols such as BUD (Anheuser Busch), LEHMQ (Lehman Brothers) and WB (Wachovia) have therefore been left out of this analysis.
I suspect the difference from including these symbols would be minimal but it’s worth remembering that there could be some bias in the results.
Fundamental data does tend to have inaccuracies so results should be treated with some caution anyway.
BackTest Results
The following table shows the results of introducing earnings rules to our baseline trend following strategy with the baseline strategy shown first:
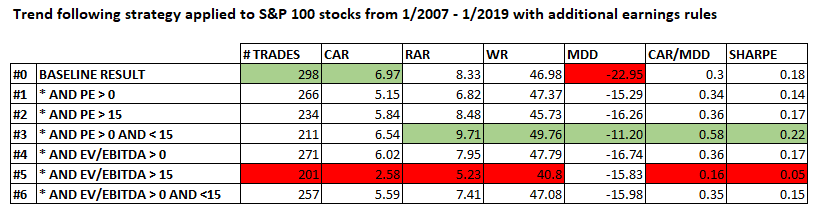
As you can see from the table above, we got some subtle but quite interesting results.
The baseline strategy produced the highest CAR (6.97%) but it also produced the largest drawdown (-22.95%).
Test three (P/E ratio between 0 and 15) produced the best risk adjusted return (9.71%), win rate (49.76%) and Sharpe (0.22). It also produced the smallest drawdown (-11.20%).
Test five (EV/EBITDA > 15) produced the worst return (2.58%), win rate (40.8%) and Sharpe (0.05).
Note: stocks with a zero P/E are stocks with negative earnings.
Best Result Equity Curve
Following is the equity curve for our best risk-adjusted result, test three:
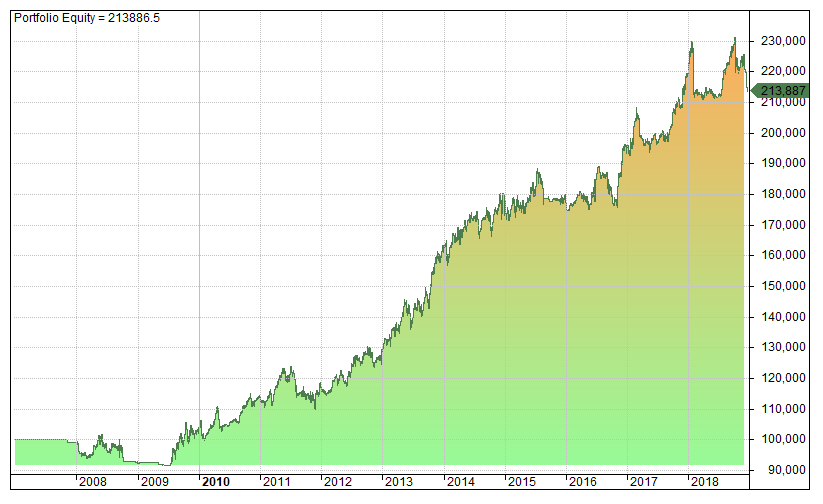
You can see that the equity curve is fairly smooth, sloping upwards and to the right.
Some Initial Observations
This is by no means a definitive test but I think we can make some crude observations about the results we have seen so far.
First, it appears that breakout trades work better when combined with a cheaper valuation.
The best RAR and drawdown were both recorded when filtering out negative PE stocks or PE more than 15.
This finding is somewhat encouraging because it makes logical sense.
If you’re buying a stock at a new high it makes sense to buy one with a cheaper valuation rather than a higher valuation as you would think a high valuation would be more likely to pull back and a cheaper stock might have more room to run.
Second, the worst result came from an EV/EBITDA valuation over 15. Again, this makes some sense for the same reason as mentioned above.
There does seem to be some difference between using EV/EBITDA and P/E, however, which may be something that needs to be looked at more closely.
What is also interesting is that this result is essentially the opposite of what was shown in our mean reversion analysis.
That analysis showed that higher P/E stocks were better candidates for mean reversion trades. But we have found that lower P/E stocks are better for breakout trades.
In fact, filtering out stocks with a P/E over 15 seems to improve results quite nicely as we have got to a CAR/MDD ratio of 0.58.
Conclusions
Conducting this analysis with fundamental data has not been easy due to certain limitations present with the data.
It would be nice to run this test on a larger database like the S&P 500 and over a longer time period such as back to 2000 or 1990.
However, I suspect such a test would contain too many missing symbols and too many inaccuracies to make it worthwhile.
We seem to take data for granted now but it’s worth remembering that twenty years ago recording millions of data points would have been a huge undertaking.
Therefore it’s not surprising that fundamental data is patchy and should always be treated with caution.
However, I think we produced a couple of interesting insights.
First, stocks with negative earnings perform poorly whether we are trading mean reversion or trend following.
Second, low P/E appears better for trend following and high P/E appears better for mean reversion.
Charts and analysis produced with Amibroker with historical data from Norgate and fundamental data from Intrinio.
Interesting study. Like that it’s backed by logic as well.
I’m working with Amibroker and to my knowledge P/E and other fundamentals are scalar, e.g can only store one point of data. How do you manage to store the historical data in Amibroker?
The data isn’t stored in Amibroker as such it is accessed real time using an API script to pull the data in from Intrinio. Thanks.