
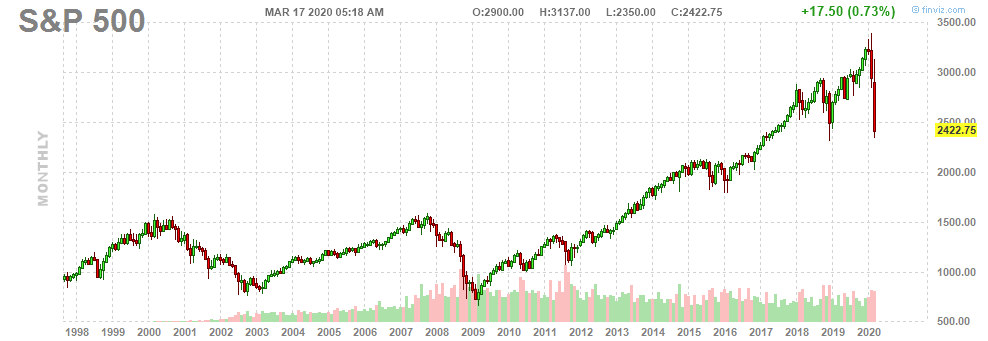
The fallout from the coronavirus has been rapid. The last few weeks have seen huge levels of volatility and the S&P 500 has dropped around 29% from it’s February peak.
If you have read any of my previous updates you will know that I have been waiting for an opportunity like this for some time.
However, I have not traded this crisis particularly well. I put a bit of money to work on the first dip around $2900 and then again around $2500 – too early on both counts.
Not being an expert in viruses or epidemics, I cannot make any claims about the virus itself and my focus in this post is the reaction of major stock markets.
A good explanation I’ve found on epidemics and exponential growth is this one on YouTube which I recommend watching if you are not already up to speed.
My Take
Looking at the situation now it appears that the market has scope to fall further as the economic fallout continues and the virus spreads.
The next major level of support would be the $2000 level and it cannot be ruled out in this environment.
However, if the virus starts to slow down, it won’t be long before stocks find a bottom given the huge amount of stimulus that central banks are providing.
For me, the most important thing is that we need to see the number of new daily cases start to flatten out.
Currently the virus is spreading at an exponential rate and that is causing businesses and services around the world to enter lock-down. That has dire consequences for company profits.
Some Notes on Exponential Growth
To summarize some of the information in the mentioned video above, exponential growth means that as you go from one day to the next you have to multiply by some constant.
In the case of coronavirus, daily cases have been increasing by about 1.15 to 1.25 times the previous day’s cases.
This results in an exponential curve with the number of new cases increasing on a daily basis. In fact, a virus provides a textbook example of exponential growth since what causes new cases are existing cases.
However, there comes a time when exponential growth has to slow down. For example, as millions of people become sick there are fewer people that can be infected so the rate of new cases must decrease.
Likewise, measures such as hand washing and limiting gatherings also have the effect of reducing the spread.
So an exponential curve will eventually level out at an inflection point and turn into what’s called a logistics curve. At this point the number of new cases each day levels out and then starts decreasing.
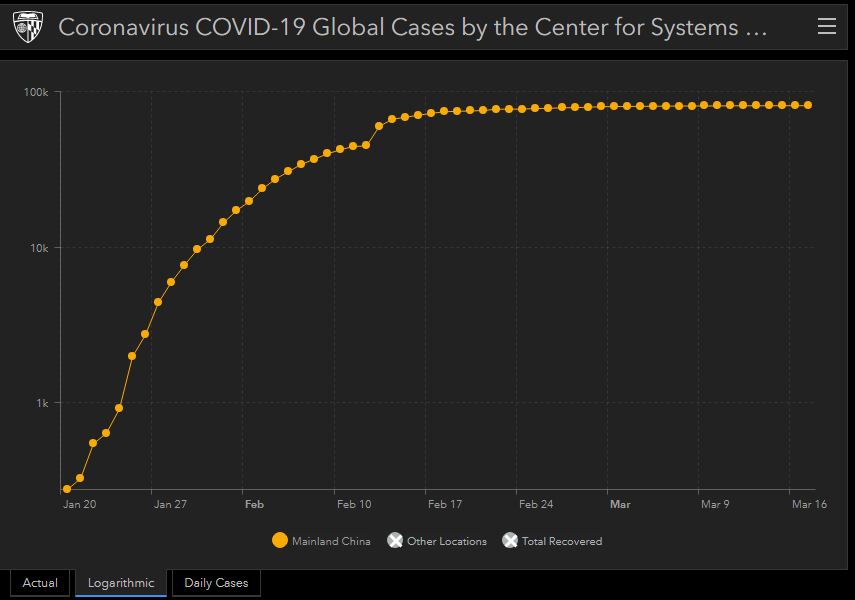
We have already seen this happen in China and now it is happening in South Korea too.
An important way to interpret the rate of exponential growth is to consider the growth factor which is the number of new cases today divided by the number of new cases the previous day.
Growth Factor = No. New Cases Today / No. New Cases Yesterday
A value over 1 indicates that we are still on the exponential part of the curve and there may be higher magnitudes of new cases ahead of us. In other words the growth is not slowing down.
This is the case right now in the USA and Europe.
Whereas a value of 1 means that growth is levelling out and a value under 1 means new cases are decreasing.
Taking China as an example, the coronavirus spread began at an exponential rate which has gradually levelled off thanks to drastic shutdown measures. With new cases appearing to have peaked the country has been able to get back to work and reboot its economy.
Meanwhile, the United States and Europe have only just started to see new cases increase, indicating that they are likely to be near the beginning of the exponential curve.
So what does all this mean for the stock market now?
For me, I think we need to see the growth rate of new cases in the US and Europe start to level off before we can put in a major stock market bottom.
So we need to see the daily growth rate drop to one or below and then stay there, perhaps for a week or so. Once that happens I think we will see a bottom in stocks and a significant relief rally thanks to the huge amount of stimulus that is being provided by central banks.
Importantly, though, I don’t think we need to see growth rates level off for the whole world. It would be enough to see growth rates in the US and Europe start to slow for a bottom to be put in. That’s because these areas (plus China) account for the vast majority of global GDP.
To keep on track of this I am using the coronavirus dashboard developed by John Hopkins University which seems to provide the most up to date and reliable figures that I’ve found. The dashboard provides the latest statistics on new cases which can then be used to calculate growth rates.
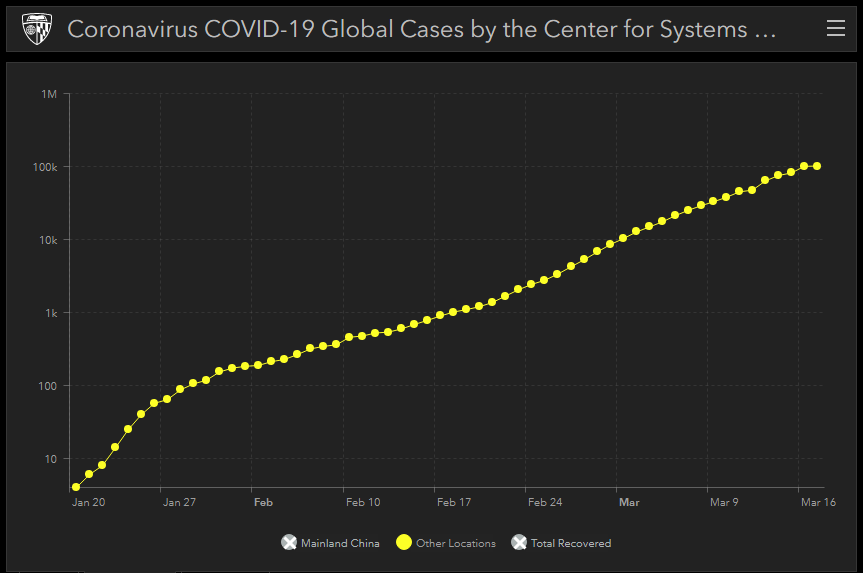
Analysing these numbers it doesn’t seem all that surprising that yesterday’s 10% drop in US stocks coincided with a huge daily growth rate of 2.8 times (this is for locations outside Mainland China).
Final Thoughts
Ultimately, virus growth rates and the stock market are linked and so long as the curve is exponential the markets are going to struggle. Although profiting from such a link is another matter.
Stock markets are likely to rally every time the virus looks to have been defeated, even when it’s not. The data isn’t entirely accurate so there is likely to be some false starts.
It’s also possible that the market will be able to lead a flattening in the virus whether it is caused by luck, government intervention or some other reason. But eventually the market will get it right.
At the end of the day, predicting this kind of thing is a precarious thing to do and it may not be worth the effort given that stocks are already off 30%.
A 30% drop in US stocks is surely a relatively good time to put some money to work.
That being said, when stocks are up and the exponential curve has leveled off, I think you can be pretty sure that the bottom is in.
Good article Joe.
Do you have any systems for capitalising on this sell off when it ends?
Like longer hold stocks that could do well, and are currently selling at a discount.
My preference would be Zero To A Million or Jesse Livermore System.
Well done, you’re quite right.
Inspired by you I have spent this morning working through the countries and it seems
– the new cases ‘curve’ is fairly consistent (even has the bump halfway up like a Rodrigue)
– China & SK have peaked. Looks like Italy has peaked, France/UK/Spain getting there
– USA well behind the curve
This tells us that the medical (self-isolation) phase may only last a few weeks. Doesn’t tell us anything about the economic shock to come in Q2 and Q3
Yes, cases in USA still increasing rapidly and market still weak. Next few days are crucial.
here’s the upshot: china has 81102 cases , with 70535 recovered. About 90% have recovered, this is recovery not due to shutdown, unless the host takes over and suppresses and the body gets healed, or china has a protocol that they have instituted resulting in a recovery. I believe in the latter, so the us better get off its pc butt, and follow china’s cue.
I believe the authorities are making (mostly) good decisions. The growth rate is very high but I’m optimistic the tide will turn soon.
you said, New cases outside China was 100.5k on Monday March 15th, higher than the previous day’s 81.7k cases and higher than the 75.1k cases on Saturday, a growth factor of 2.8.
where are you getting a growth factor of 2.8?? show me your derivation of that?
Thanks
81.7 – 75.1 = 6.6
100.5 – 81.7 = 18.8
18.8 / 6.6 = 2.8
From my calculations, today’s growth rate is 1.57. Happy to hear otherwise.
Thanks for the article – good analysis.
With the social distancing measures and widespread work from home & related shutdowns, I’m also optimistic that the US will “blunt the curve” and dodge the worst case outcomes.
That said, layoffs and furloughs have already started here, so it’s hard to know what the economic impact will be. Keeping my fingers crossed it doesn’t end up as bad as 2008.