One of the keys to successful system trading is to be able to combine different strategies together. When you are able to combine less correlated strategies, it is possible to smooth drawdown, boost win rate and therefore improve your overall risk-adjusted returns.
In Amibroker it is possible to combine equity curves together so you can see what the advantages are.
Notice that in the first paragraph above I mention ‘less correlated’ instead of ‘uncorrelated’. That’s because it is rare to find profitable strategies that are completely uncorrelated. But so long as a system has a profitable edge and is slightly uncorrelated, great things can still be achieved.
An Example Of Combining Trading Systems
As an example, consider two trading systems.
The first is a long-only stock system that follows trends. The second is a mean reversion short-only system. The table below shows the key statistics from each system on it’s own.

On the face of it, you would probably prefer to trade system 1 on it’s own since it has a higher annual return and a smaller drawdown than system 2.
However, when we combine the systems, we can see what would have happened if we had traded both systems at the same time (with equal amount of capital allocated to each).

As you can see, although our annualized return has decreased slightly, we have significantly reduced our maximum drawdown.
Our CAR/MDD ratio has now advanced to 1.03 indicating that combining the two systems leads to smoother, more consistent performance. As a result, we are likely to experience fewer losing streaks as well.

How To Combine Equity Curves In Amibroker
Now that we have seen the benefits of combining trading systems we can look at how to combine equity curves in Amibroker and there are two main options available. Both options can be used to combine the equity curves of multiple trading systems.
Option 1 – AddToComposite Function
The simplest option is to use the Amibroker AddToComposite function to save the equity curves to a special ticker and then combine them together with another formula.
Bascially, every time Amibroker runs a back-test, it stores the equity of the trading system in a special ticker known as “~~~EQUITY”. This ticker gets re-populated every time a new back-test is run.
However, with the AddtoComposite function we can save the equity to any ticker name we like so that we can use it later on.
All you have to do is add the following code underneath your trading system rules and when you run a back-test your equity from that test will be saved to the new ticker called “~~~MY_EQUITY_COPY”.
// The code for AmiBroker 5.50 and above
// YOUR TRADING SYSTEM HERE
// ....
SetCustomBacktestProc("");
if( Status("action") == actionPortfolio )
{
bo = GetBacktesterObject();
bo.Backtest();
AddToComposite( bo.EquityArray,
"~~~MY_EQUITY_COPY", "X",
atcFlagDeleteValues | atcFlagEnableInPortfolio );
}
Here is the Amibroker page that explains it.
Once you have your equity curve saved as a symbol you can use it in various other ways and combine it with a different equity curve.
An Example
For example, I ran two trading systems, one long and one short.
For the long trading system I saved the equity using the above formula as “~MY_EQUITY_long“.
For the short trading system I saved the equity as “~MY_EQUITY_short”.
Note: I could have chosen any name I wanted here such as “SYSTEM_A” or “MY_SYSTEM”, however, using ‘~’ at the beginning makes it easier to find the ticker in the symbol list.

Next, I opened up the formula editor and typed in the following code:
System1 = Foreign("~my_equity_long","Close");
System2 = Foreign("~my_equity_short","Close");

Combined = (System1 + System2) / 2;

Plot(System1,"System1",colorgreen,styleline);
Plot(System2,"System2",colorred,styleline);
Plot(Combined,"Combined",colorBlack,styleline);
This formula simply adds the equity of system one to the equity of system two and then divides them by two.
Hit Apply Indicator and the formula plots all three equity curves in Amibroker as below:
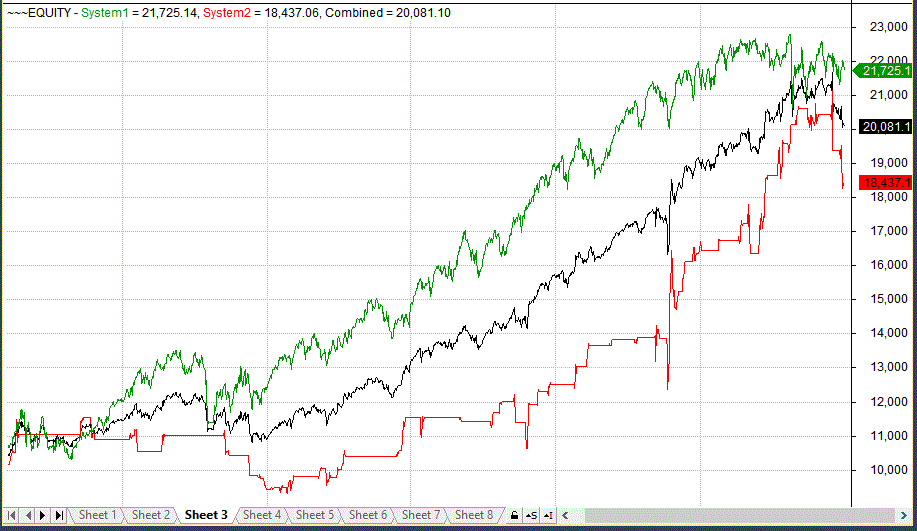
As you can see, the black combined equity curve gives a lower return than system one but a smoother ride.
Now, to see the actual statistics of this combined system, all you have to do is run a buy-and-hold backtest on the two saved tickers.
To do this, I created a new watchlist called “Combined” and I added the tickers ~MY_EQUITY_long and ~MY_EQUITY_short.
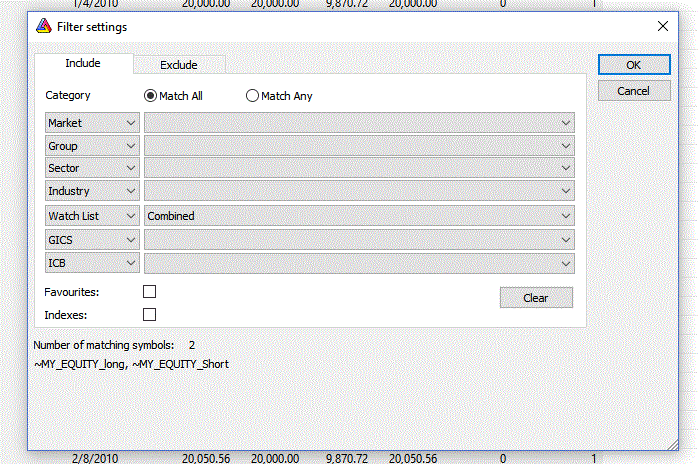
Then I ran a simple buy and hold back-test on the new watchlist using another simple formula:
Buy = 1;
Sell = 0;
In the backtest settings I set the number of open positions to two and I made the initial capital large enough that we can afford to buy both tickers.
Note: You may need to play around with your initial capital so that you have enough equity to buy both tickers and you will need to tick the box in the back-tester settings that disables trade size when there is no volume – because our equity tickers have no volume stored.
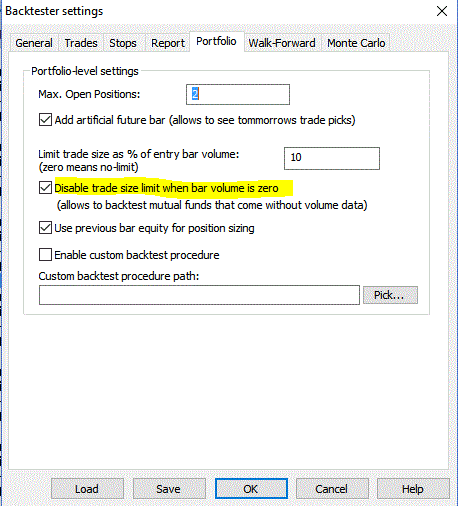
Now you can run the buy and hold back-test.
Make sure to split your starting capital equally between the two tickers (or however you want to allocate it) and the results will give a good representation of what would have happened if you had traded both of your two trading systems together.
To recap, here are the steps to combine equity curves in Amibroker:
- Use the AddToComposite formula to save each equity curve to it’s own symbol
- Combine the two equity curves using the formula editor and plot on a chart
- Add the two equity curve symbols to a new watchlist
- Run a buy and hold strategy on the new watchlist
Option 2 – Export To Excel
Option 1 is a simple way to combine equity curves in Amibroker that works most of the time.
However, I have had some problems with this method when dealing with complicated trading strategies or when back-testing on a very large number of securities.
If you run into this problem too, there is another simple solution by exporting the equity quotes for each system to Excel.
You can then combine the equity quotes in Excel. Simply add the quotes together and plot a new chart.
Or you can re-import the combined equity quotes back into Amibroker and then run a buy and hold system as before.
Here are the steps to take for this route:
Step 1.
The first thing you’ll need to do is run your back-test and then export your quotes to a format that Excel will be able to read.
Follow the steps listed on the AB website about how to export quotes to CSV.
All you have to do is run an exploration on your equity ticker “~~~EQUITY” and export the quotes.
After your backtest is finished open up the formula editor and paste the following code:
Filter=1;
AddColumn(O,"Open");
AddColumn(H,"High");
AddColumn(L,"Low");
AddColumn(C,"Close");
AddColumn(V,"Volume",1.0);
AddColumn(OI,"Open Interest",1.0);
Click Tools > Send to Auto-Analysis and you will be ready to run this formula on any ticker you like.
Select the equity curve symbol “~~~EQUITY”, click ‘Apply To‘ ‘current symbol‘ and choose range: all quotations.
Now hit Explore and Amibroker will deliver all the quotes for your equity symbol.
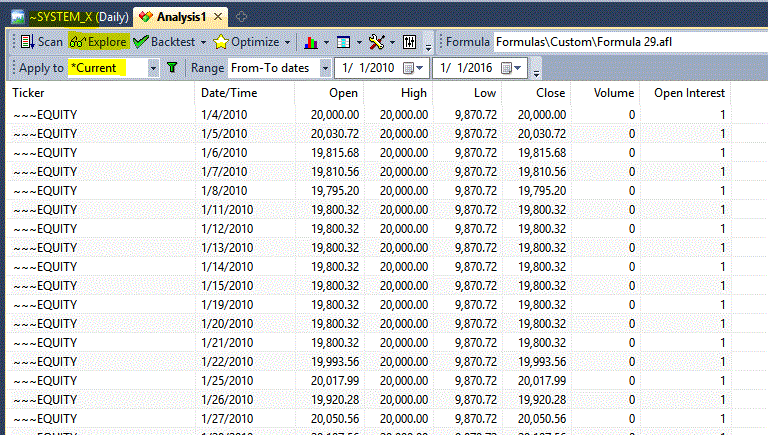
At this point you can click File > Export CSV or you can right click on the results, select all, then copy and paste them into Excel.
Once you have exported the equity quotes for your first system you can move on to the second trading system and do the same thing.
Note that every time you run a backtest the data in your equity symbol is replaced with the latest simulation results unless you tell Amibroker otherwise.
Step 2.
At this point you should have two CSV files containing daily equity quotes for your two trading systems.
The first thing to do is to rename the tickers so you don’t get the two mixed up. You can call one System X and one System Y.
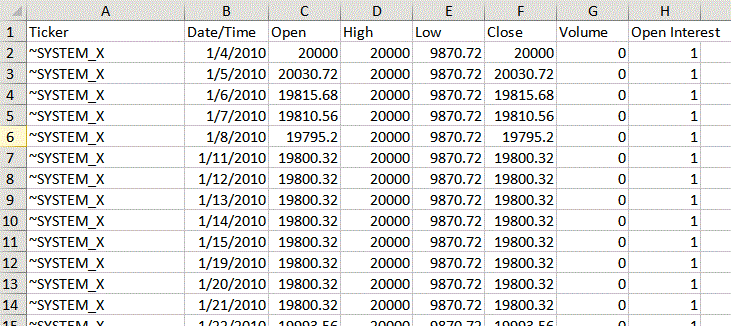
Now you can combine the two together in Excel. Just add the price quotes of the two tickers together and then divide by two.
For example if system X has a close of $20030.72 and system Y has a close of $19795.2 on the 1st January you add them together and divide by two to get $19,912.96. You do this for every day that contains quotes (O, H, L, C).
You can call this new data Equity Z because it contains the quotes from X & Y combined. Now you have the combined equity data you can plot an Excel graph to see the equity curve.
Alternatively, you can import this ticker back into Amibroker and run a simple buy and hold test.
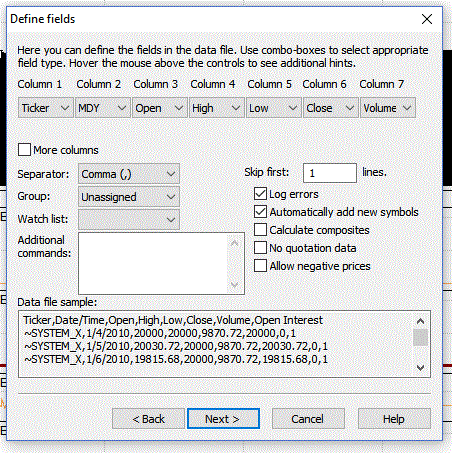
Simply go to the import wizard, import the CSV for Equity Z, then run a buy and hold test on that ticker.
Conclusions
Although there is (currently) no native functionality to combine equity curves in Amibroker it can be achieved quite simply with a variety of methods.
In this article we have looked at two simple methods that get the job done. Using Amibroker AddToComposite and exporting Equity symbols to Excel.
These methods can be used to combine two, three, four or even more equity curves and thereby analyse the statistics of those combined systems.

Both options are time-consuming and still don’t give a chance for optimal using of betsize based on combined equity.
The problem is that such option of joining the systems should be built-in without neccessity of making such combinations as described by you (thank you anyway).
I know what you mean. It would be nice to push a button and have it all done for us. Maybe in future versions. Option 1 is pretty quick though, once you have the formula saved.
It seems Tomasz Janeczko is very reluctant to add such option to Amibroker. At least I got such impression after reading Amibroker forum.
Yeah, well it’s up to him I guess.
Hii JB,
How do you allocate different percentages to systems. For example if I want to invest 70% in System 1 and 30 % in System 2 rather than 50/50 as shown in above example.
Thanks.
Hardik Upadhyay.
There is more than one solution.
One way, something like:
SystemA = Foreign(“SystemA”,”C”);
Positionsize = IIf(SystemA,-70,-30);
Another way, run the backtests individually – $7k in system A, $3k in system B (for 10k portfolio) then combine the curves.
in Option 1 could you please explain the last step in detail. How to run a buy and hold test on the watchlist assuming there are 2 symbols and we want to allocate 50% to each?
Hi Joe,
beginner here,
I did follow your instructions, however, in the end I got no results displayed.
System1 = Foreign(“~~~MY_EQUITY_GAPUP”,”Close”);
System2 = Foreign(“~~~MY_EQUITY_GAPDOWN”,”Close”);
Combined = (System1 + System2) / 2;
Plot(System1,”System1″,colorgreen,styleline);
Plot(System2,”System2″,colorred,styleline);
Plot(Combined,”Combined”,colorBlack,styleline);
I pasted this into a blank AFL field and no curves displayed, I combined both systems under one watchlist – no results, any ideas?