Humans have been trying to time the stock market with fancy indicators since the beginning of time. But do they work? In this article I test five different market timing indicators. They are:
- Coppock Curve
- Zweig Breadth Thrust
- Arms Index (TRIN)
- McClellan Oscillator
- No. Of New 52-Week Lows
These market indicators are all available with my historical database from Norgate Data.
1) Coppock Curve Indicator
The first indicator we will test is the Coppock Curve.
The Coppock Curve first appeared in a Barron’s article in 1962 and was invented by economist Edwin Coppock.
The indicator takes a weighted moving average of the rate-of-change and is designed to spot long term trend changes in market indexes.
According to Investopedia, you should buy when the Coppock Curve moves above zero and sell when the indicator moves below zero.
Coppock Curve Strategy
- Buy the S&P 500 SPY ETF when the Coppock Curve moves above zero.
- Sell when the Coppock Curve moves below zero.
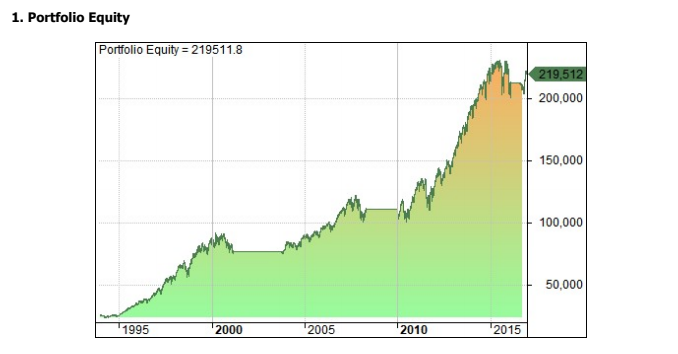
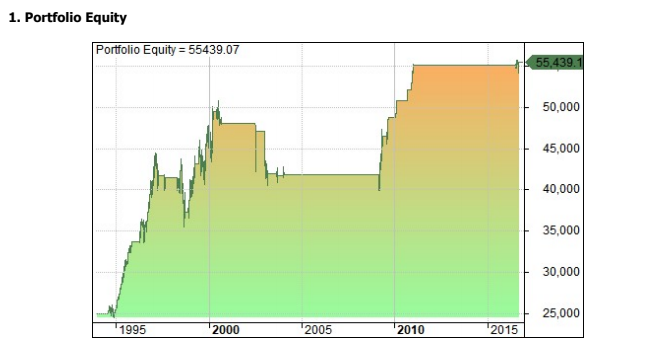
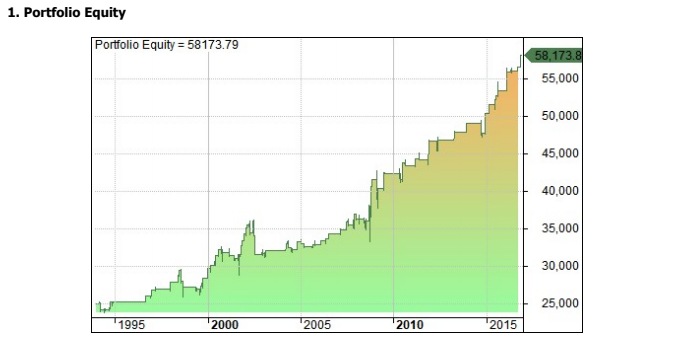
Testing this strategy between 1/1994 – 1/2017 resulted in an annualised return of 9.90% with a maximum drawdown of -19%. There were four trades in total and each one was a winner.
This compares to a buy and hold return between 1/1994 – 1/2017 of 9.09% with a max drawdown of -55%.
For an indicator that was developed in 1962 this is not such a bad result. The performance is better than buy and hold on a risk-adjusted basis.
Below you can see the equity curve taken from Amibroker with a $25,000 starting capital:
2) Zweig Breadth Thrust
Developed by Marty Zweig, the Breadth Thrust indicator takes the number of advancing issues in an index divided by the total number of issues (advancing and declining). A 10-period exponential moving average is then laid on top.
According to most sources, you should buy when the indicator moves from a level of under 40% to a level above 61.5% within a 10-day period.
This is noted as a rare sentiment shift and usually comes at the beginning of a new bull market.
Zweig Breadth Thrust Strategy
- Buy SPY when Zweig Breadth Thrust moves from below 40% to above 61.5% within a 10-day period.
- Sell after 20 days.
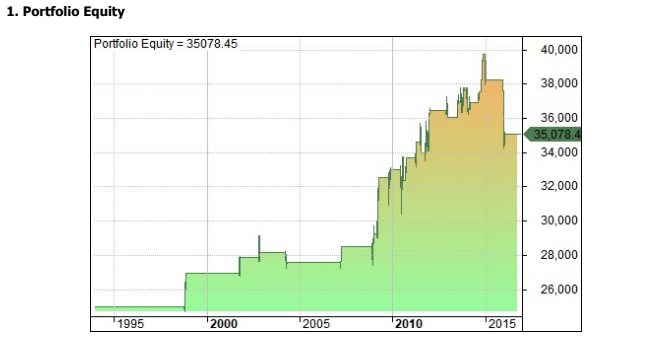
I tested this strategy between 1/1994 and 1/2017 and got an annualised return of 1.48% with a maximum drawdown of -14% and a win rate of 65% across 26 trades.
Below you can see the equity curve as taken from Amibroker:
3) Arms Index (TRIN)
The Arms Index was developed by Richard W. Arms in 1967 and is also referred to as the TRIN. This is another market breadth indicator. It’s calculated by dividing the advance-decline ratio by the advance-decline-volume ratio.
There are a number of interpretations on how to use TRIN and some suggest it is most useful for day traders.
According to this article, you should go long when the 10-day moving average of TRIN moves below 0.8 and sell when it moves above 1.2.
Arms Index (TRIN) Strategy
I tested buying SPY according to the above definition between 1/1994 – 1/2017 and recorded an annualised return of 3.52% with a maximum drawdown of -22% and a win rate of 65% from 20 trades.
Following is the equity curve taken from Amibroker. You can see that this is a rare signal in recent times so the settings may need to be altered:
4) McClellan Oscillator
The McClellan Oscillator is another market breadth indicator. This one is based on the smoothed difference between the number of advancing and declining securities on the NYSE or some other market index.
Ratio Adjusted Net Advances (RANA) = (Advances – Declines) / (Advances + Declines)
McClellan Oscillator = 19-day EMA of RANA – 39-day EMA of RANA
Looking online, I found it difficult to find any consistent definition on how this oscillator should be used.
According to one article, you should be bullish when the McClellan Oscillator moves above zero and bearish when it moves below zero.
I tested this on the SPY ETF and the results were poor. I also tried a number of other variations which also showed net losses. The best result came from a strategy taken from Futures Mag.
McClellan Oscillator Strategy
- Buy SPY when the McClellan Oscillator moves to between -70 and -100, then turns up.
- Sell SPY when the McClellan Oscillator moves to between 70 and 100, then turns down.
In other words, we are looking for the indicator to move down into an oversold range before turning back upwards.
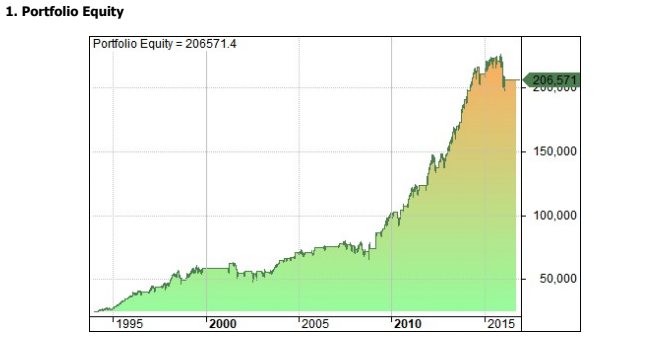
This strategy generated an annual return of 9.61% with a maximum drawdown of –24% and a win rate of 76% over 45 trades between 1/1994 and 1/2017.
This compares to a buy and hold return between 1/1994 – 1/2017 of 9.09% with a max drawdown of -55%.
This indicator has some interesting characteristics and it is always nice to see a win rate above 70%. You can see the equity curve below:
5) Number Of New 52-Week Lows
The final stock market indicator we will look at today is the number of stocks making new 52-week lows in comparison to the index itself.
This is a classic indicator that can be used to measure strength in the prevailing trend and is also useful when looking for divergence.
You can see that in the chart below the number of stocks hitting new 52-week lows hit a peak of over 400 (out of 500) in 2008.
New 52-Week Lows Divergence Strategy
- Buy SPY when it closes at a new 20-day low but the number of stocks making new 52-week lows goes down.
- Sell five days later.
This strategy is based on divergence. The index has hit a new low but the stocks that make up the index have not made new 52-week lows. This suggest the downward trend is weakening and an upturn could be on the cards.
This strategy produced an annualised return of 3.74% between 1/1994 and 1/2017 with a maximum drawdown of -14% and a win rate of 62% over 100 trades.
Below you will find the equity curve produced in Amibroker:
Conclusions
There are countless numbers of different indicators on the market but few are able to generate profits superior to buy and hold. We have looked at five indicators here and the results are mixed.
The Coppock Curve Indicator, McClellan Oscillator and Number of New 52-Week Lows Divergence strategy look fairly interesting and they might be useful for day traders or as market timing filters.
For example, traders could use these indicators to only take trades when certain conditions line up. These strategies might also be enhanced with extra leverage or adapted for futures.
As usual, the data proves there is no easy money available in the stock market despite what is claimed by the inventors and promoters of simple market indicators.
—
All charts produced in Amibroker using data from Norgate.
Simulations assume transaction costs of $0.01 per share and trading on next bar open. Data is adjusted for dividends and corporate actions.
Interesting analysis of some less common indicators – thanks for all the great posts lately JB!
Hi,
Thanks for posting the tests.
Unfortunately, Investopedia gave you a bum steer re the use of the Coppock indicator. It is commonly misused.
The Coppock indicator was devised to do only one thing — signal to long-term investors to begin accumulating at the start of a bull market.
The signal to begin accumulating is the turning up of the Coppock indicator from below the zero line. Coppock suggested accumulating a diversified portfolio of the strongest stocks relative to the market.
Coppock also insisted that the indicator was only useful for finding the start of a bull market. It was not designed to identify selling signals and Coppock stated that he used other indicators for that purpose.
Thanks for that comment Larry. It’s not always easy to get to the true thought process behind an indicator. That sounds like a better way to use it.
Great article, Joe can you share the AFL code for these, few are easy to code but the Zweig and couple other are a challenge? Thanks
Dated: 6/10/21
Hello Joe, Can you walk through the math that corresponds to chart labeled “1. Portfolio Equity” for the Coppock Curve indicator? not following how the performance is adding up to +$219K in equity over 10 years?
$25,000 has compounded at an annual rate of 9.9% to finish at $219k final equity. Am I missing something?