
There’s a reason that international traders, whether they’re in Tokyo, Singapore, or London, follow the US markets. The US is the hub of global finance. It’s on Wall Street where everything is happening.
Watching the reaction of European markets to the opening of US markets demonstrates this. When the US market bell rings, there’s a spike in volume (and volatility) across European assets.
The US influences all markets globally. If US stocks soar, there’s a high chance that Asia Pacific markets will follow the next day (it’s 7 pm Eastern Time when Tokyo starts the new trading day). And if US stocks tank, the rest of the world follows.
This lead-lag pattern has been observed for a long time (see for example this research paper).
If you believe that the US market is leading, then the big question is how to profit from this. It’s actually not so easy in the short-term (day trading) because bear in mind: you can only trade during market hours. And as international markets open, the gap is generally priced in already.
A Longer Timeframe
It’s hard to beat the market using the discussed lead-lag mechanism over the short-term. But what about a longer timeframe?
In a 2009 research paper titled “International Stock Return Predictability: What is the Role of the United States?” (freely available on SSRN), the authors find that US monthly returns are predictive for the next month’s non-US stock returns.
In a statistical regression model, lagged US stock movements are shown to be a significant predictor of international returns. Regression models are the go-to approach of academic research. The problem is at this point, we only know that there is some predictive value in the lead-lag relationship. We do not know whether we can actually profit from this relationship.
Another remarkable finding is that the US lead-lag predictability is one-way only. The opposite does not hold, i.e. international returns do not predict US returns.
How can all of this be explained? First, the US is the hub of global finance. As the US does well economically (and therefore US stocks go up) there must be spillover effects. There could be an increased US demand for international goods, or US companies might increase their international investments. Spillover effects that benefit the economy and lead to a circular feedback loop in other stock markets.
In the research paper mentioned, the authors further expand the selection of predictors to include lagged interest rates and dividend yields. In this post, we will do something similar.
Investing in Global Markets
Thanks to the wide availability of global ETFs, international investment has become accessible to everyone. We talked about international investing and international crisis investing before. (Something to revisit with the current events taking place in Ukraine).
Below you can see our world map of international country ETF tickers. (Our data sources were Norgate Data and ETF DB).
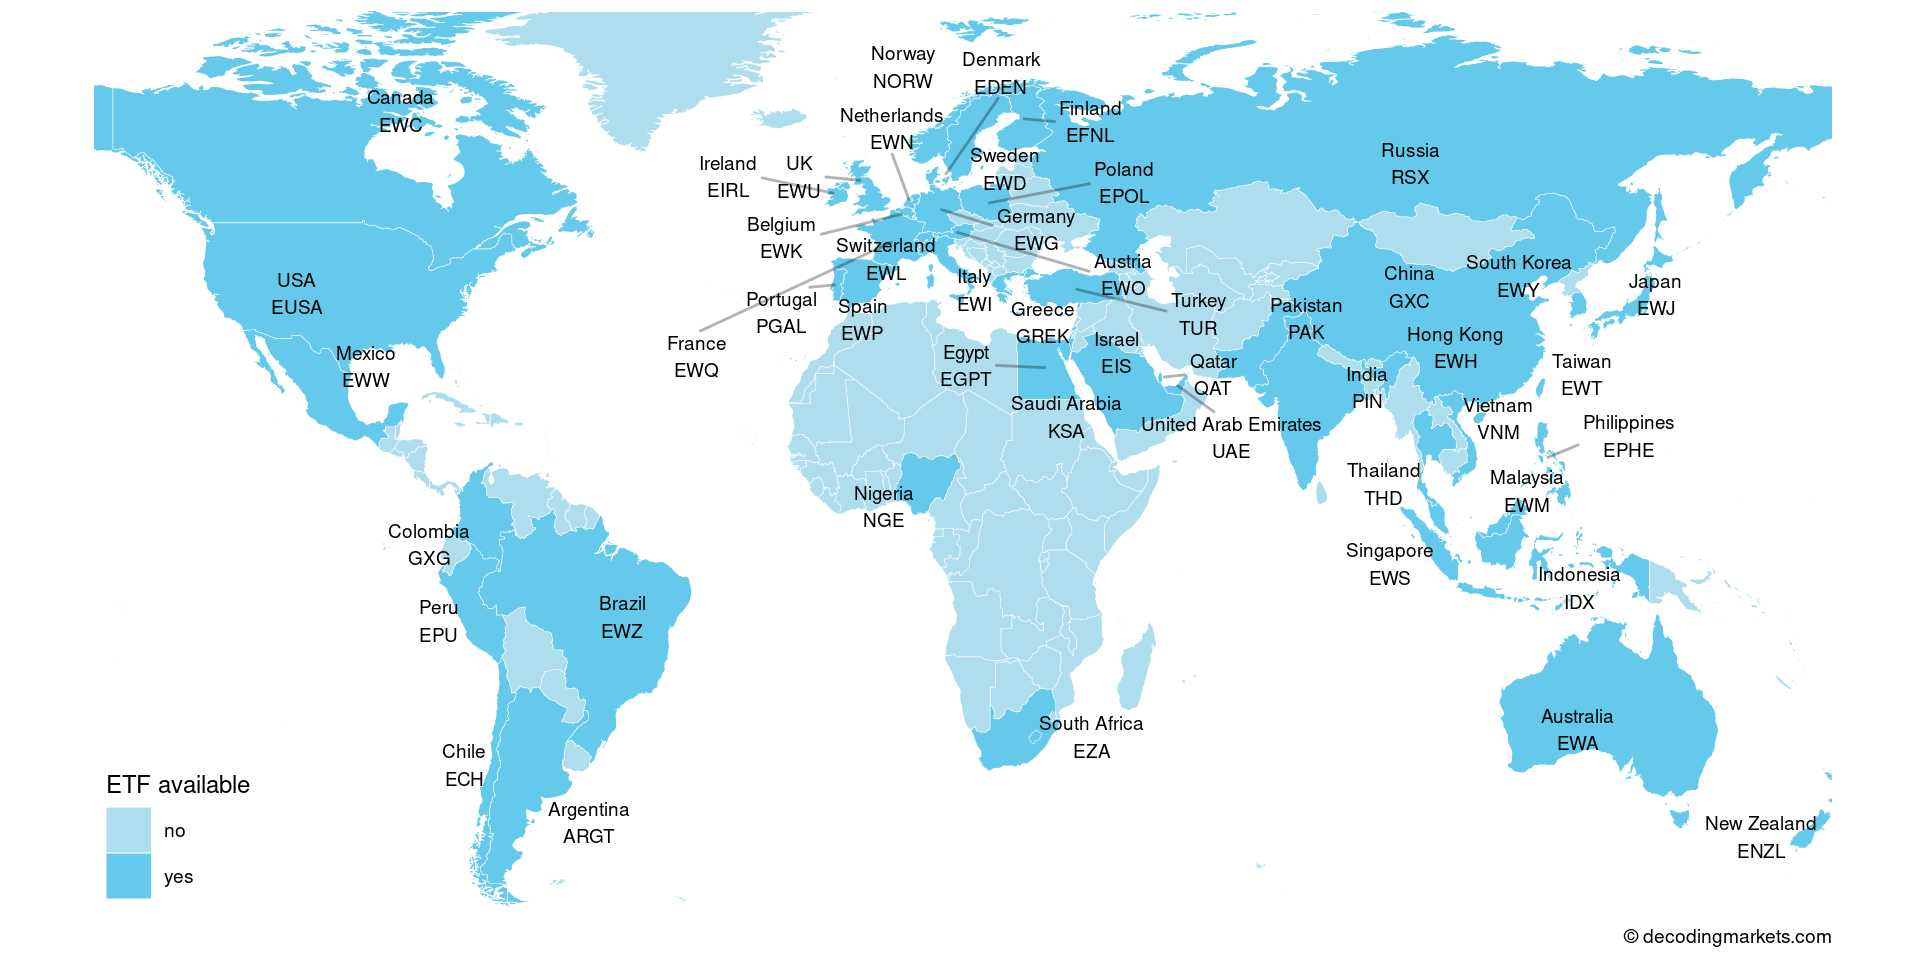
You can invest in different nations world-wide, or you can buy a developed World ETF (e.g. iShares MSCI World, ticker URTH) or an Emerging Markets ETF (e.g. iShares MSCI Emerging Markets, ticker EEM).
In the strategies below, we use country ETFs. But to reduce the number of individual transactions, you could also use the Emerging Markets ETF (EEM).
Global Trading Strategies
To evaluate the US return leading signal, we backtest a simple trading strategy (Strategy #1). The rules are as follows:
- When the prior month’s return of the S&P 500 index was positive, invest in international ETFs
- When the prior month’s return of the S&P 500 index was negative, position into long term US Treasury bonds (ETF ticker: TLT)
We track the S&P 500 index using SPY. The investment in international ETF is equal-weighted among all global ETFs available. (Alternatively, you could also use the ticker EEM replacing the individual international ETF selection. You can see by the two blue lines below that the performance is very similar).
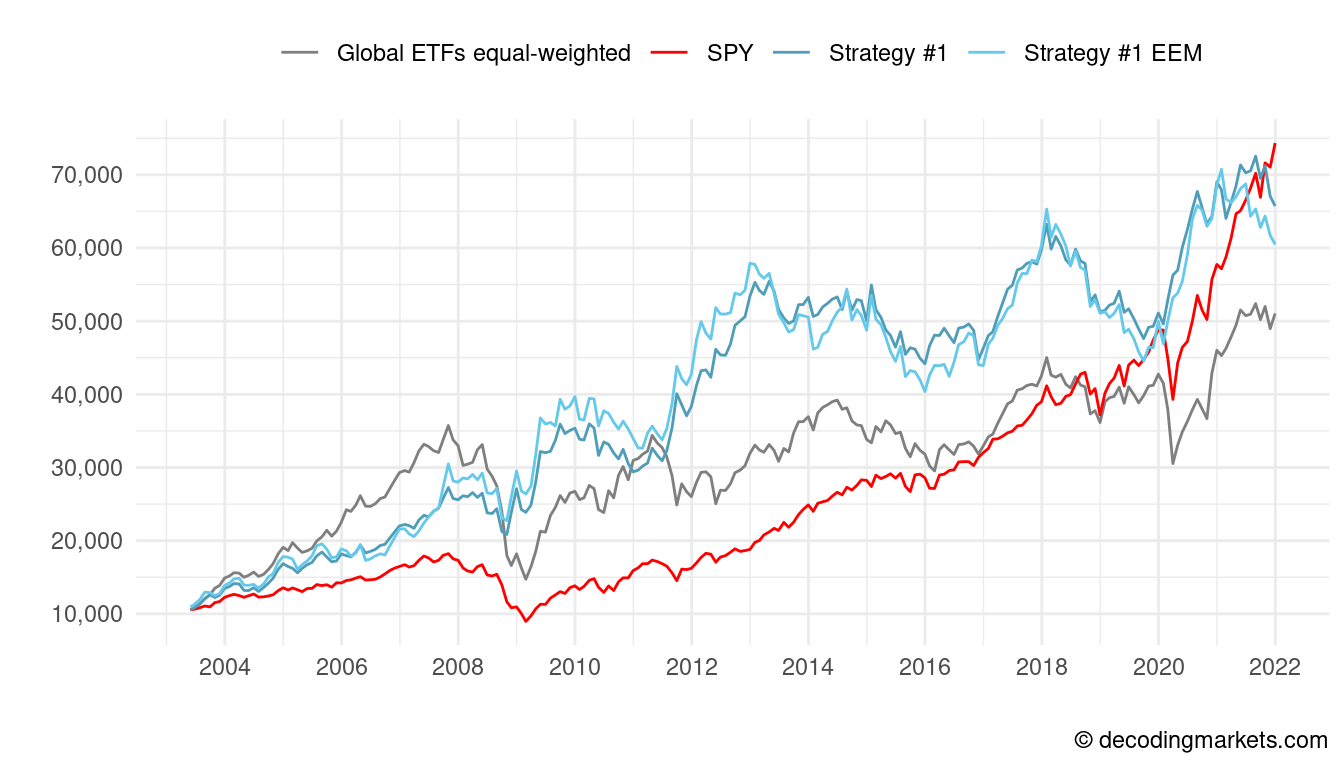
The strategy we created (Strategy #1) clearly outperformed the equal-weighted global ETF portfolio (buy-and-hold). However, compared to SPY, the strategy added some volatility and was pipped at the post by the end of 2021.
Still, what is remarkable is that the strategy avoided the major drawdowns in 2008/09, 2011, and 2020, simply by rotating to the defensive side (TLT) when US stocks disappointed in the prior month.
Building on this, and similar to what was done in the research paper, we add a second predictor: the yield spread.
Briefly explained, the yield spread (or credit spread) as we shall use it, is the difference between the interest rate of long-term (10-year) and short-term (3-month) government bonds. If the long-term yield is well above the short-term rate, this is a bullish signal for the economy.
On the other hand, if long-term rates fall below the short-term rate (called an “inverted yield curve”), this is considered a strong indicator for a possible recession.
Below is an example of an inverted curve (beginning of 2001), a flat curve (2006), and two rising/normal yield curves (2010 and 2022).
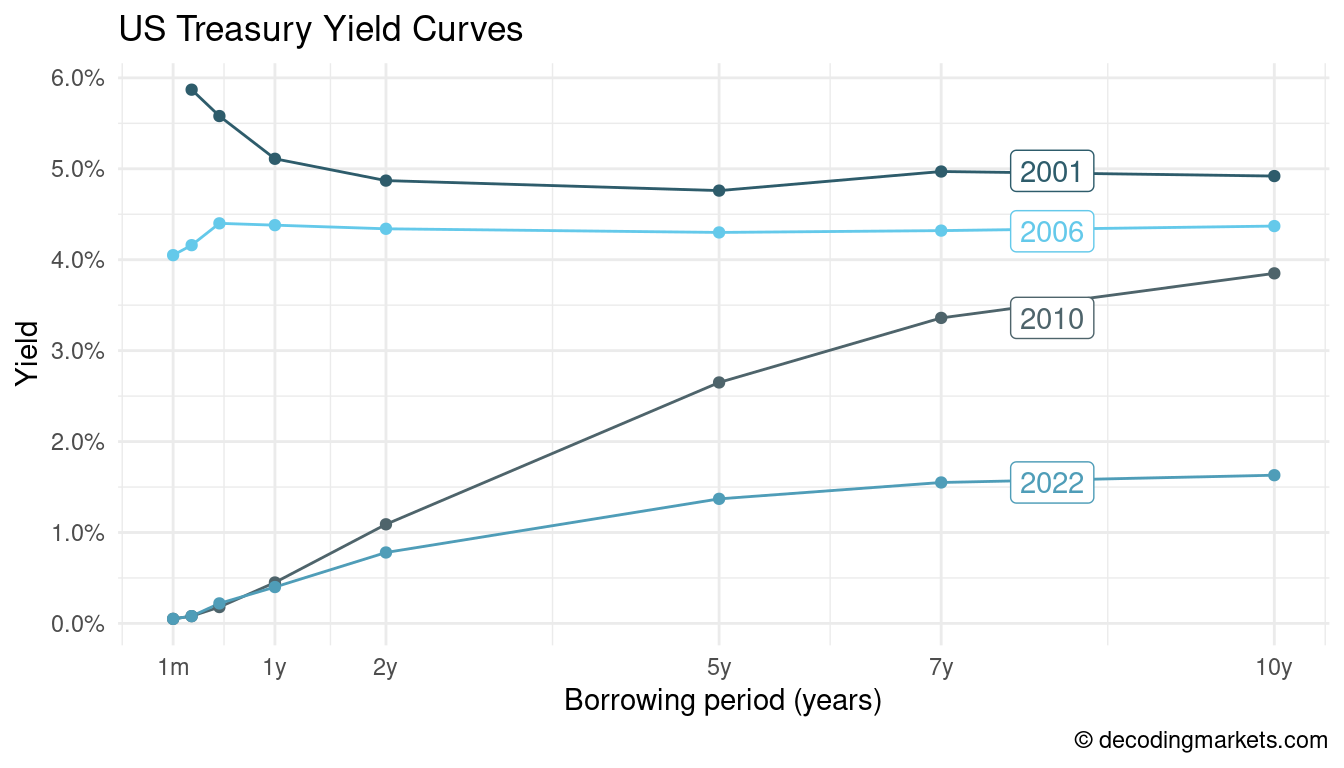
Our data source for the interest rates is FRED.
Including the yield curve, the following rules are set (Strategy #2):
- When the prior month’s return of the S&P 500 index was positive…
- and the prior month’s yield curve of a country was normal, invest in that country’s ETF
- and the prior month’s yield curve of a country was flat or inverted, invest that proportion in the SPY
- When the prior month’s return of the S&P 500 index was negative, position into long term bonds (ETF ticker: TLT)
We set the threshold for a normal yield curve at a 1-percent spread between 10-year and 3-month government bonds.
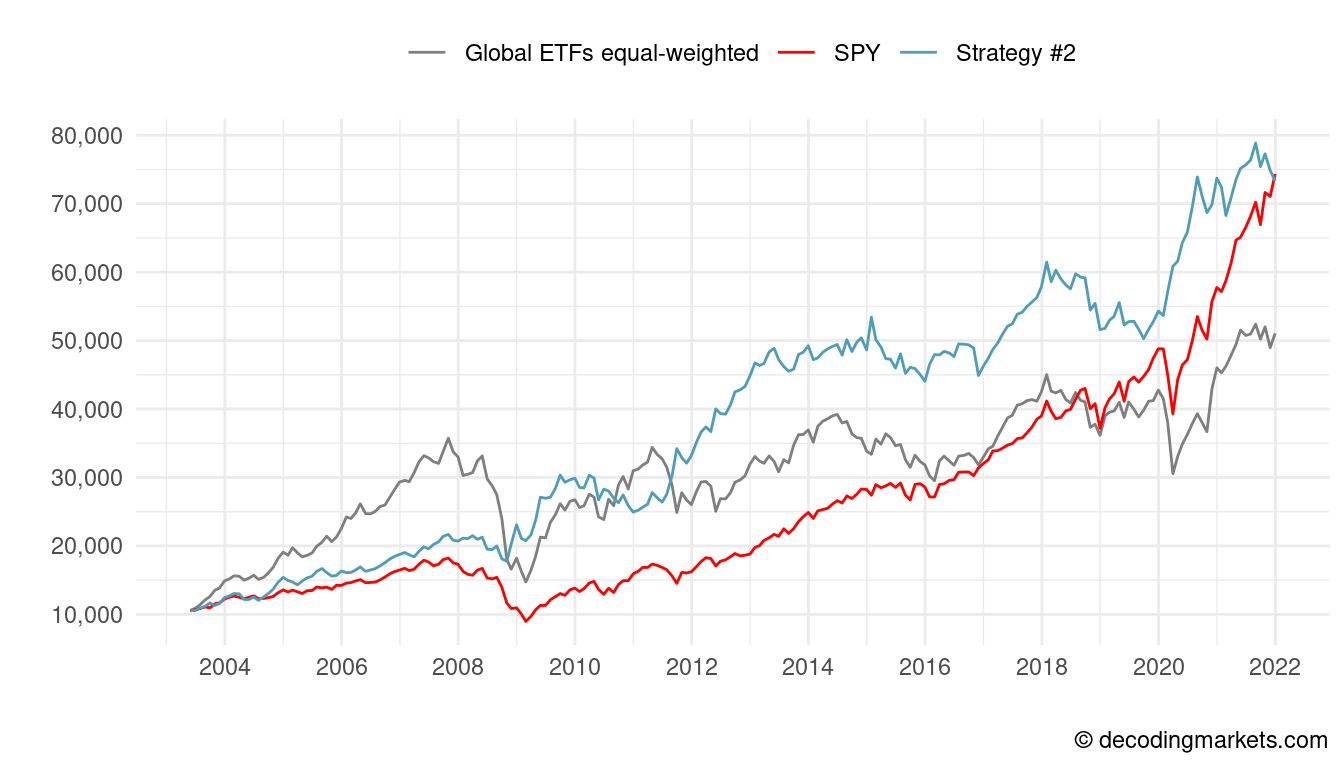
Compared to Strategy #1, we left some profits on the table between 2003 and 2008 (but still beat the SPY).
As a final adjustment, we add a simple moving average (SMA) rule (Strategy #3):
- When the prior month’s return of the S&P 500 index was positive…
- and the prior month’s yield curve of a country was normal and it’s trading over its 3-month SMA, invest in that country’s ETF
- and the prior month’s yield curve of a country was normal and it’s trading below its 3-month SMA, invest that proportion in the SPY (unless the SPY is also below its SMA, in which case we invest in the TLT)
- and the prior month’s yield curve of a country was inverted, invest that proportion in the SPY (unless the SPY is also below its SMA, in which case we invest in the TLT)
- When the prior month’s return of the S&P 500 index was negative, position into long term bonds (ETF ticker: TLT)
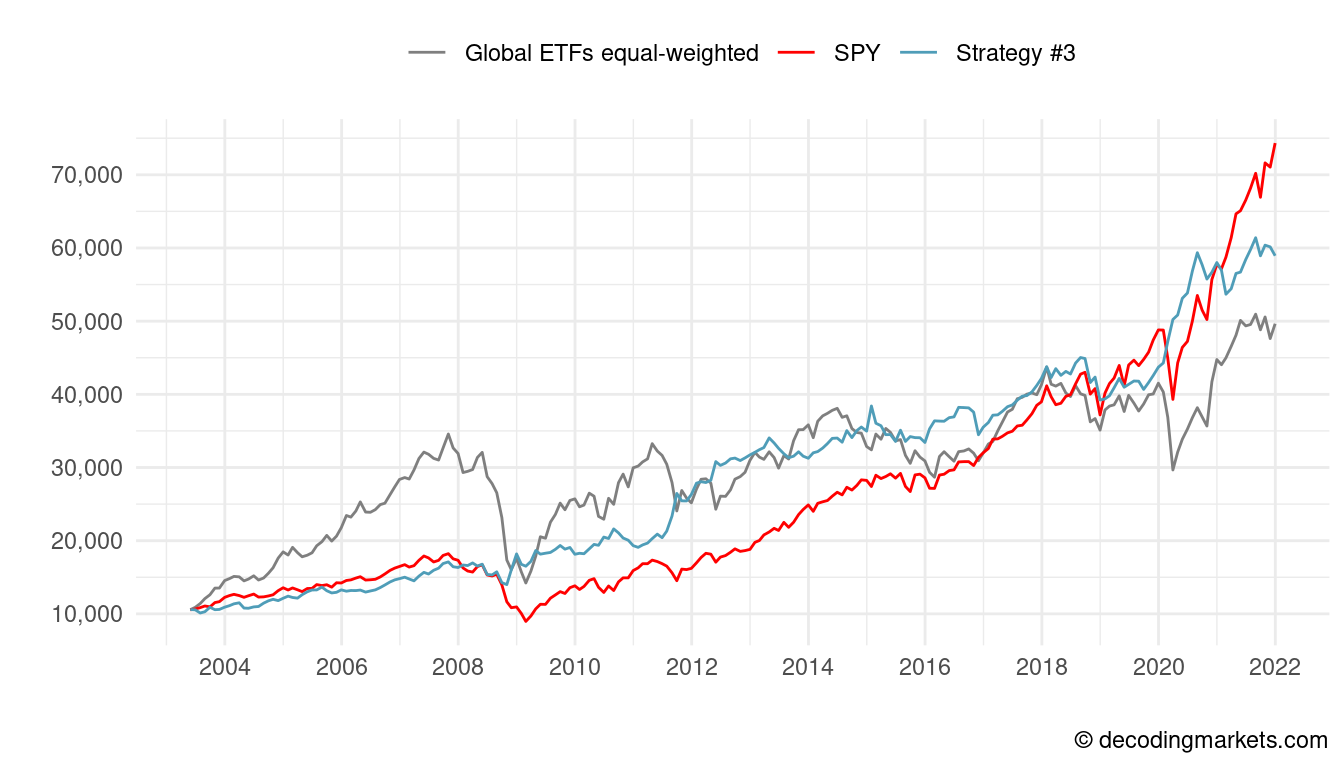
While this looks less spectacular than the previous charts, we achieved a clear reduction in volatility and drawdowns. Our strategy (strategy #3) provides a smooth upward sloping return with reduced drawdown.
The value of the SMA is not outperforming on the upside but to dodge the downside. As Jeremy Siegel notes in “Stocks for the Long Run”, “the major gain of the [moving average] timing strategy is a reduction in risk.”
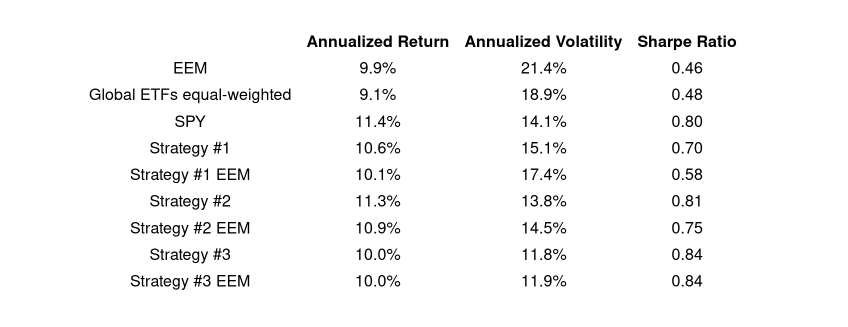
Below are the performances stats for everything we have discussed so far from March 2003 – December 2021:
Final Thoughts
We have seen that monthly US stock returns are predictive of the following month’s global stock markets. This may be partially attributed to momentum.
Positive (or negative) periods tend to drag on. A month closing higher is more likely to be followed by another month closing higher than by a month closing lower (and the other way around).
However, the effect is stronger in international markets. If the US is doing well and stock markets rise, this causes spillover effects to all of the world. The world gets its share from the US doing well economically (more international trade, easier access to financing, etc.). This makes perfect sense.
We add the yield curve of each country as an additional predictor, and impose the rule to only invest internationally if the curve is rising (normal yield curve). This further improves the risk-adjusted results.
Additionally, adding a SMA rule strongly reduces the volatility.
In all of the strategies, we see a clear inverse movement up when global stock markets correct. Solely by rotating into the defensive asset (TLT) when the US market was down before, you would have avoided the brutal losses in 2008/09 and 2020.
One last mention for critical readers that might say our strategies are over-fitted. Indeed they look good in the backtest, and surely there is no guarantee for them working out in the future.
That said, we believe signals (lagged US returns, yield curve, moving average) are backed by reasonable economic explanations. Therefore we see the results as relatively robust and likely to be superior to rudimentary buy and hold.
Notes: Analysis and simulations produced in R, Excel and Amibroker. Data from Norgate and ETFDB.