
In order to make a profit in stocks you need to sell at a higher price than you purchased.
Because of this, many traders look for stocks that have dropped to extremely oversold levels in the hope that they will bounce back from their low levels.
One such pattern traders look for is known as the waterfall pattern.
The Waterfall Pattern
The waterfall pattern is a mean reversion setup defined by three down candles that are increasing in size. The stock appears to be in freefall and almost moving exponentially. The stock should also be trading at a new 50-day low.
Trade Example
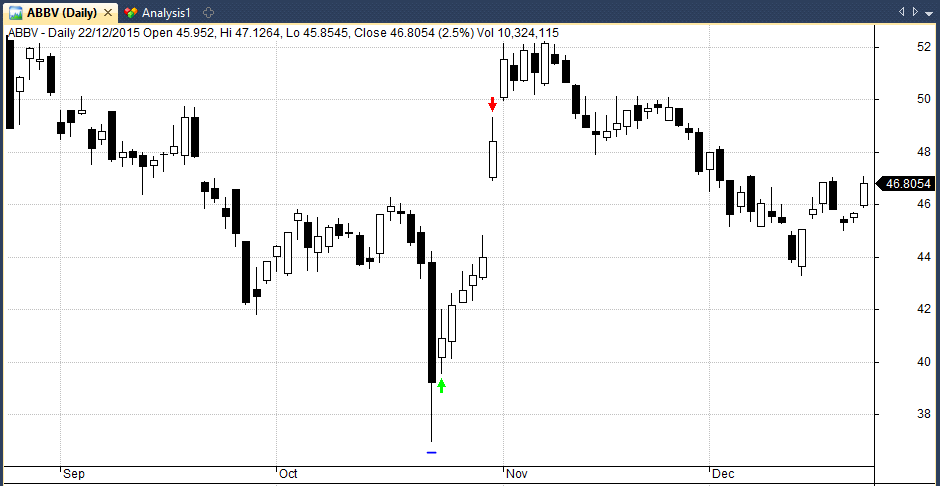
The following chart provides a perfect illustration of the waterfall pattern in ABBV. You can see we have three down candles before we go long on the green arrow.
Each candle gets larger and the oversold condition becomes more and more extreme before the bounce back occurs:
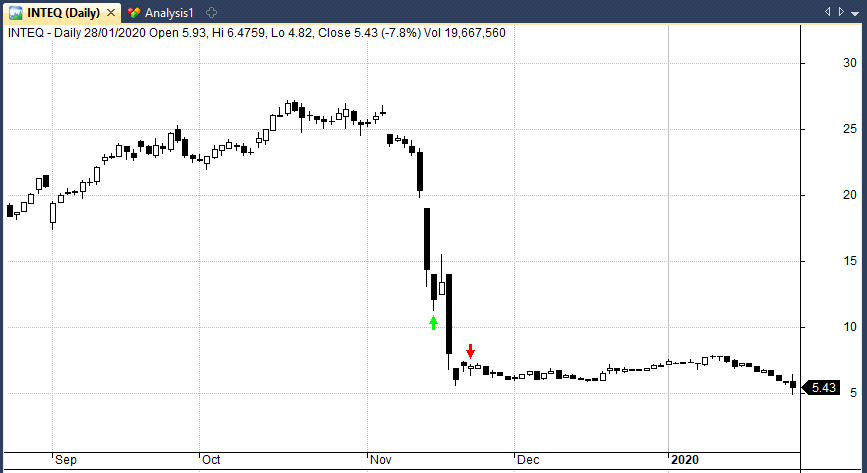
However, not all waterfall patterns are profitable and some simply lead to more losses, like this one in INTEQ:
Testing The Waterfall Pattern
In order to test the effectiveness of the waterfall pattern, I translated the pattern into code and then backtested it on historical data for the S&P 500 and Russell 3000 US stock universes.
I defined the pattern as follows:
- Three consecutive down candles
- Three consecutive lower closes
- Each down candle has a larger range than the previous one
- New 50-day low
Whenever we see this pattern we will go long on the next open and then hold the trade for X number of days.
We are going to test this pattern on historical data for thousands of US stocks and then compare our results to a benchmark result for all stocks in the sample.
Test Results On The Russell 3000
The following table shows the average profit per trade and risk-adjusted return for the waterfall pattern on Russell 3000 stocks going back to 2000:
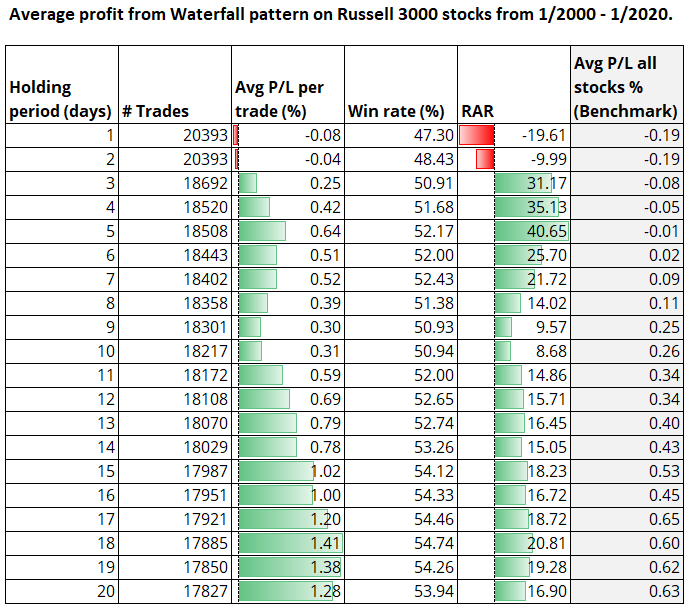
As you can see from the table above, the waterfall pattern appears to have a positive expectancy in the Russell 3000 with anything above a 2-day holding period.
Reassuringly, every holding period we tested beat the corresponding return for all stocks in the sample. For example, the average profit per trade with a 5-day holding period was 0.64% while the average profit for all stocks in the sample was -0.01%.
(Note that we have used quite a stringent transaction cost here of 0.1% per trade).
Overall, the results are quite promising and suggest the pattern may have some edge.
Test Results On The S&P 500
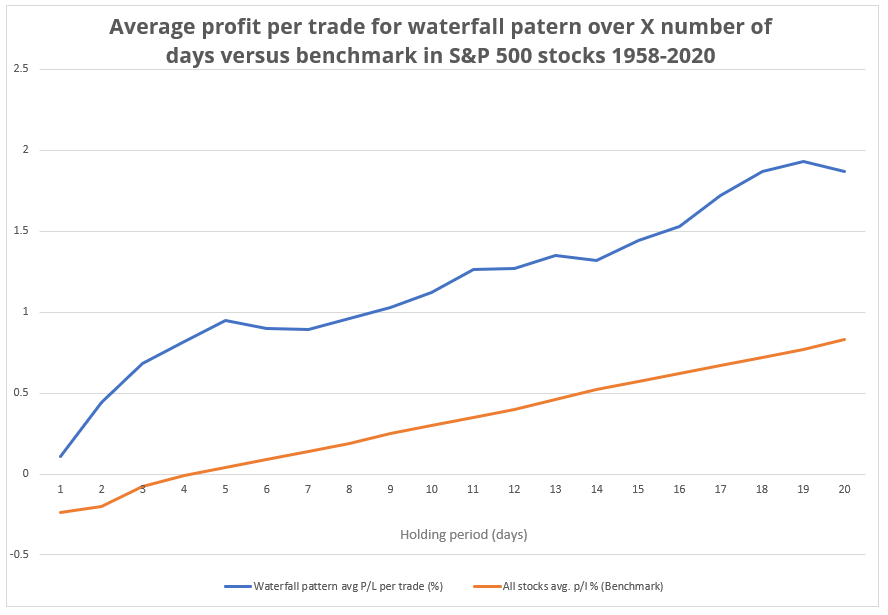
The next graphic shows the performance of the pattern across S&P 500 stocks going all the way back to 1958.
You can see once again that the waterfall pattern (blue line) appears to have a positive expectancy and performs better than the average return (orange line) across every holding period:
Portfolio Test
Considering the strong results so far the next step is to translate this into a full blown portfolio strategy.
The portfolio strategy is the best way to verify whether a pattern is worth trading since it gives us the timeline of results and introduces real world portfolio constraints.
For example, the pattern might produce an incredible profit per trade but if all the profitable trades come in a single month, it will be no good to us.
We cannot rely on such a system and we probably wouldn’t be able to implement every trade signal simultaneously.
To run the portfolio test we will apply the following settings:
- Universe: Russell 3000 (includes historical members)
- Dates: 1/1990 – 9/2020
- Starting Capital: $50,000
- Max Portfolio Size: 10
- Position Size: 10%
- Compounding: Yes
- Ranking: Highest Turnover
- Holding Period: 5 Days
- Transaction Costs: 0.05% per trade
Portfolio Test Results
The following statistics and equity curve show the performance of the portfolio test of the waterfall pattern on the Russell 3000 from 1/1990 to September 2020:
- Net Profit: 1106.33%
- Annualised Return: 8.45%
- Max Drawdown: -78.08%
- CAR/MDD: 0.11
- Win Rate: 52.79%
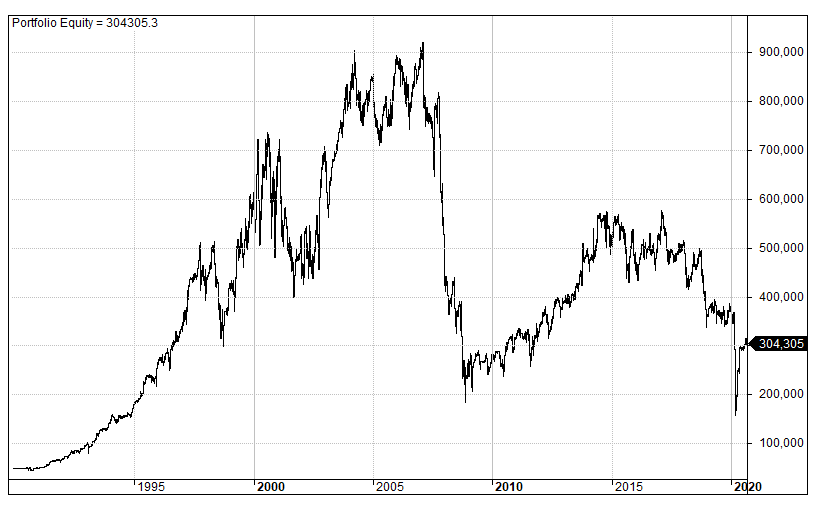
As you can see from the results above, our initial good results for the waterfall pattern have not been confirmed in the portfolio test.
You can see that the equity curve has periods of good performance (particularly in the 1990s) but underperforms significantly in other years.
This leads to a choppy equity curve and little evidence that the strategy has any edge in recent times. This is a disappointing result considering the positive performance in our previous tests.
Conclusions
In this post we tested the historical performance of the waterfall pattern and found that it does not produce attractive returns on it’s own.
Although the pattern showed a profitable expectancy across a large sample of trades, with real world constraints the equity chart becomes unreliable.
This analysis underlines the importance of running a portfolio test and not simply relying on historical statistics from any trading pattern.
Running a test on all historical trades is a useful first step because it shows the performance of the pattern on a large sample.
However, any test should be confirmed with a portfolio test because it is the most realistic simulation of a trading strategy.
In this case, the distribution of winning and losing trades and the severity of the losing trades means that the strategy is not an attractive proposition.
Losing trades tend to be large and are bunched together which makes the system volatile.
Final Thoughts
Some traders may insist that this strategy could be improved with a market regime mechanism to get the system out during bear markets. Or with alternative rules such as a stop losses, limit orders, exit rules etc.
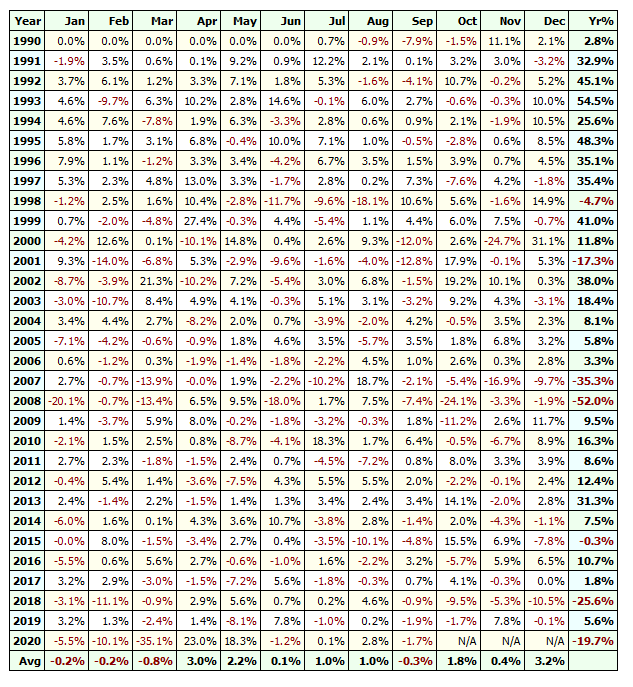
That is certainly worth exploring and there are many things we could try. However, I do note that the system still did not perform well in 2017 or 2019 which were good years for stocks.
Overall, this pattern needs a lot of work. The truth is that buying a stock simply because it is oversold is rarely a worthwhile strategy.
A failing company can always get more oversold and go to zero. The trick is to find oversold stocks where the fundamentals have barely altered.
Notes
Data used for this analysis comes from Norgate Data and includes historical constituents and delisted stocks so as to minimize survivorship-bias. Data also includes dividends, is adjusted for splits and corporate actions. Stock charts and analysis produced in Amibroker.
Your last sentence holds the key to profitable mean-reversion patterns!
haha, yeah!