The Market Meanness Index is a technical indicator developed by JCL from the Financial Hacker website. In this article we will describe what the indicator is designed to do and provide some code for Amibroker users.
MMI is a statistical algorithm based on the median value of a price series. It’s purpose is to help detect whether the market is in a trending mode or range mode. It therefore provides traders with an excellent filter for trend following strategies. If the market is not trending then you can save yourself some money and skip the signal coming from your trend system.
Understanding The Market Meanness Index
As stated by the author. the Market Meanness Index is based on a statistical fact – a series of random numbers will revert to the median with a probability of 75%. This is because, by definition, half the series of prices will be below the median and half will be above. Therefore, if a market is not moving in a similar pattern, prices are not random and more likely to be trending.
According to its creator, MMI can’t be used to predict price movement, it’s only used to detect whether ‘trend is trending’ and therefore whether a trend signal has a good chance of being profitable or not.
JCL suggests that MMI should be calculated over a minimum of 200 bars and smoothed with a low pass filter or similar low lag moving average.
A perfectly efficient market (with random price sequences) would return an MMI value of around 75%. Therefore, a falling MMI value that is under 75% suggests an inefficient market and is a good indicator of a real trend. Meanwhile, a rising MMI suggests that the market is becoming more efficient and the trend is becoming unsustainable.
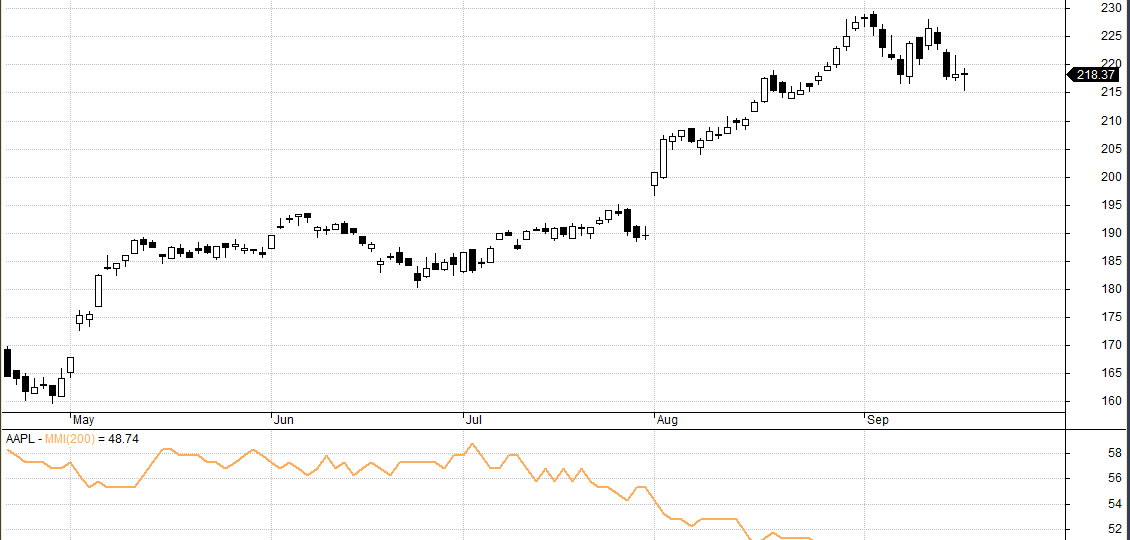
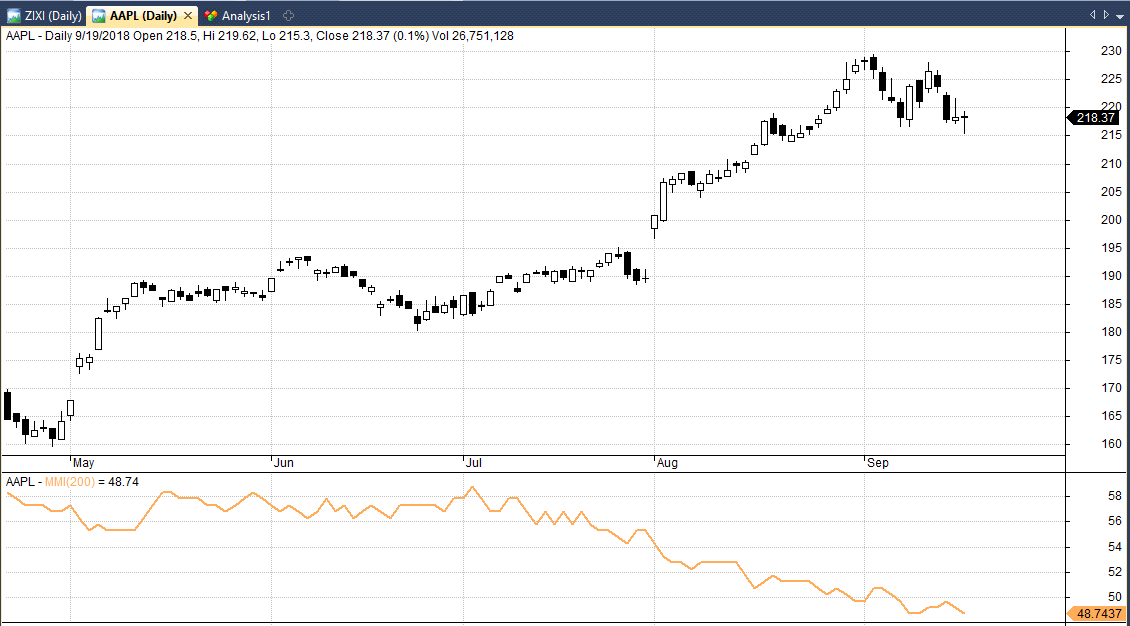
In the following chart, you can see a 200-period MMI plotted below Apple stock. You can see that the MMI (orange) begins to decline since July just as Apple starts an upward trend. This is quite a nice example of the MMI in action:
Market Meanness Code And Calculations
With some help from Matt Radtke we have put together some Amibroker code for the Market Meanness Index as below:
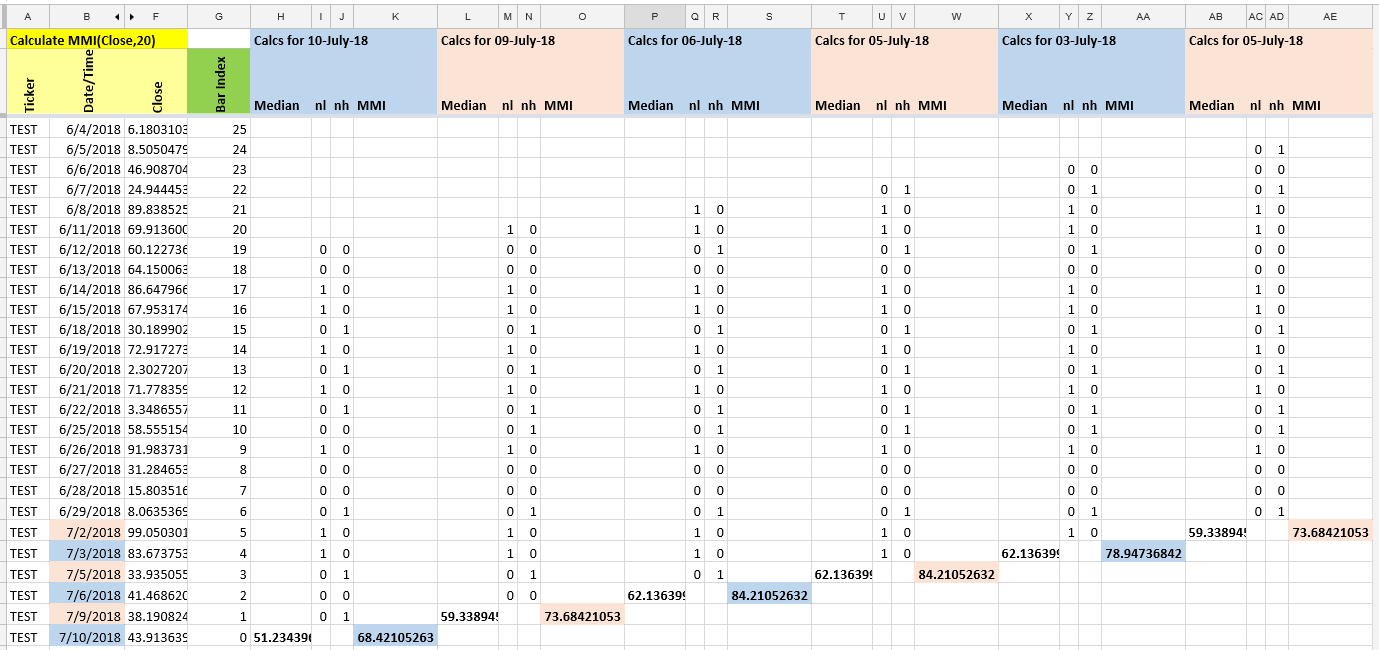
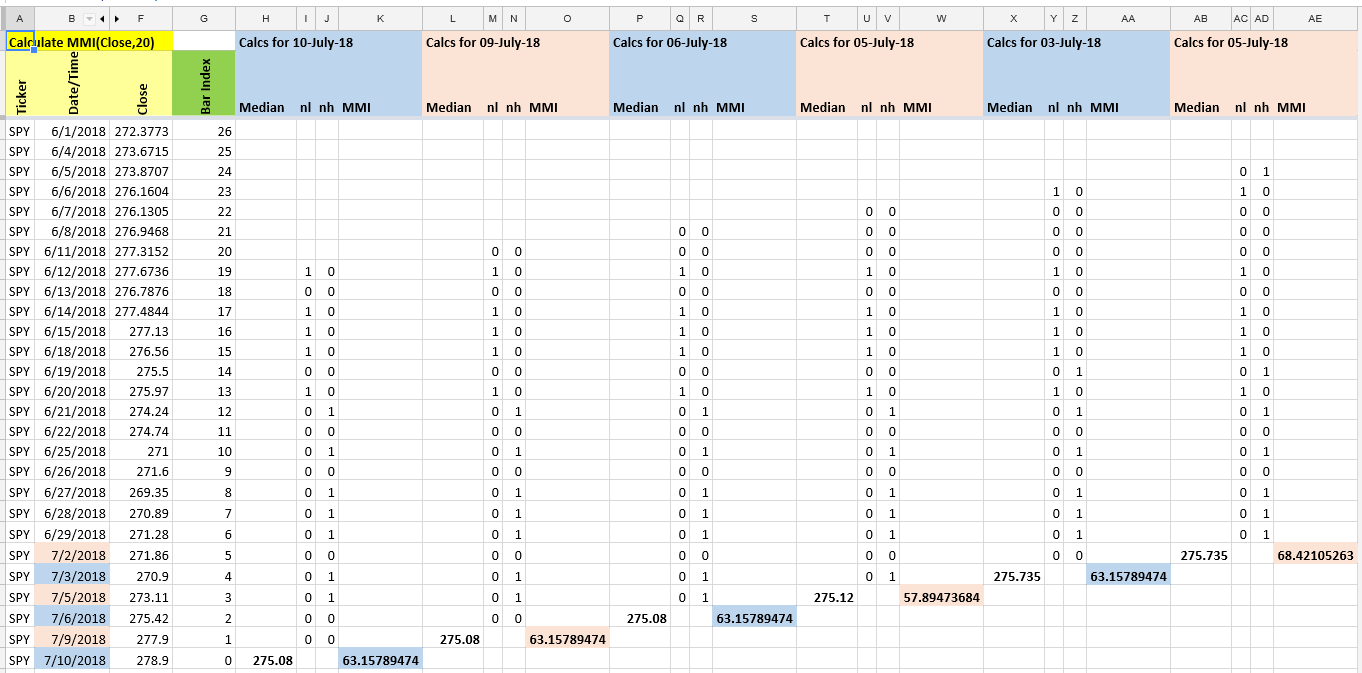
To better understand how this indicator works it’s a good idea to consider the following couple of worksheets that were used to create this indicator. You can click the images themselves to get a better view.
In the worksheets, columns H through K contain the calculations used to create MMI for the price series up to July 10, 2018. Similarly, columns L-O calculate MMI for July 9th, and so on.
So in this first worksheet, you will see that we have a price series of random numbers in column F. MMI has been calculated on this random data and the resulting values are shown for six different date ranges. The MMI is shown in columns K, O, S, W, AA and AE. You can see that we are returning MMI values between 68 and 84 based on this random data series.
Now in this next worksheet, we have replaced the random price series with a trending series. You can see now that we have a perfect price trend in column F starting at a value of 100 and ending in 125. And you can see that the MMI value for this perfect trend is 52.63.
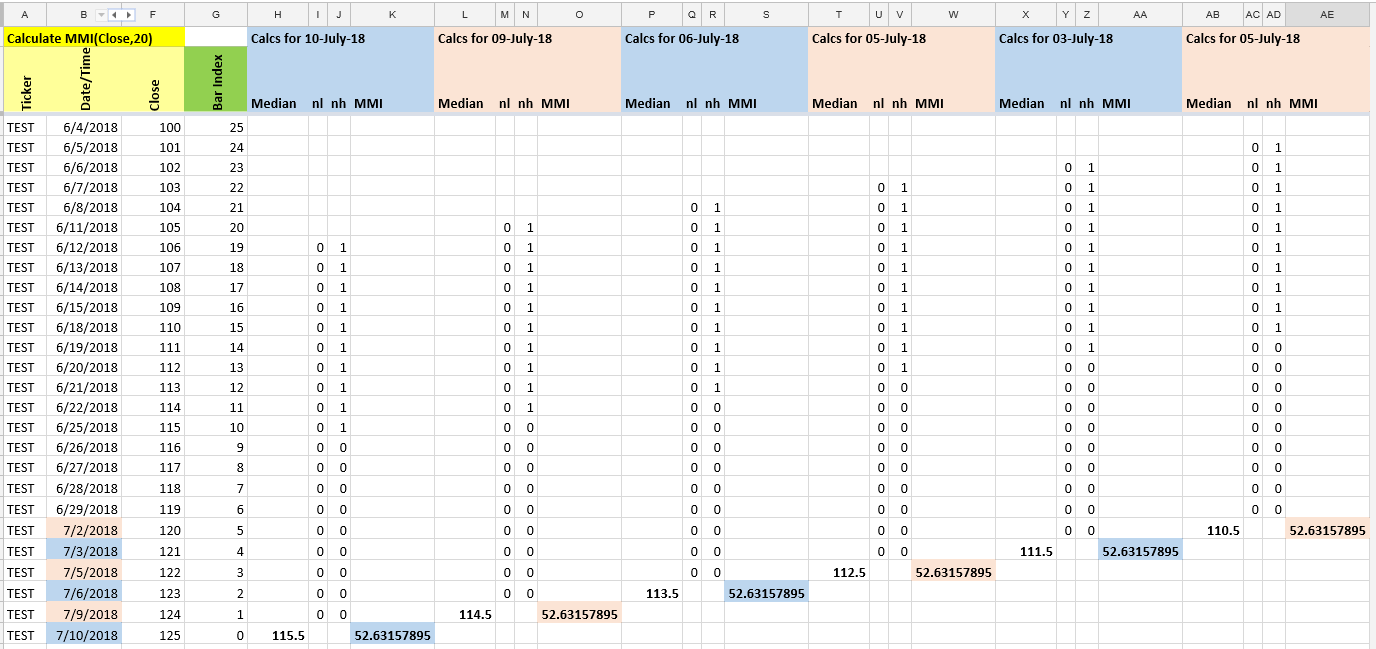
In other words, a random market produces a MMI value around 70-80 while a solid trend produces a MMI around 53.
Finally, in the next sheet you can see some calculations for real SPY data. Notice that the MMI fluctuates from 58 to 68.
In other words, SPY during this date range is not showing complete randomness but it isn’t showing a strong trend either.
Market Meanness In Action
The idea of the MMI indicator is to filter out trend signals that have a poor chance of success. It is used to find the best trending market environments.
I have briefly used this indicator on US equity markets on it’s own and by smoothing the indicator with an EMA and also an ALMA (Arnaud Legoux Moving Average) as suggested by the author.
I found that the MMI does improve some simple trend following strategies that I tried. However, I have a feeling it may be better suited to currency markets and higher timeframes.
I need to spend more time with this indicator but so far it does look promising as a trend filter. Take it for a spin and let me know what you think.
Some reason, it is showing a black chart (all values zero), please help
Sorry but need more info. It is working as shown for me and others who have downloaded it. Make sure there are no formatting issues.
Hi, Joe. I found this to be an interesting indicator concept. Based on your last couple sentences in article about MMI, wondering if you had spent more time investigating this indicator. Thanks.
No I haven’t looked at it since I wrote this as I moved on to some other things, cheers.
Hi,
sorry to bother you. Could it be possible to take a look at the formulas in the spreadsheet? I would like to replicate the calculations on Excel.
Thanks a lot and congratulations on a fantastic site!
Alberto
I will have a look for it.
Hi sir I’m ask is possible to share MMI Afl for Amibroker or mast to buy