• Skip to main content
  • Skip to primary sidebar
  • Skip to footer

Decoding Markets

  • Top Posts
  • Courses
  • Resources
    • Books
  • Free Class
  • Blog
You are here: Home / Stocks / 50 Day Moving Average Strategy – Put To The Test On Stocks

February 4, 2014 By Joe Marwood 1 Comment

50 Day Moving Average Strategy – Put To The Test On Stocks

In this article I look at a simple 50 day moving average strategy and use the simulator from Amibroker to test the strategy on the stock market.

When it comes to technical analysis and trend following there is no shortage of naysayers.

Academics like to say that markets are perfectly efficient and that short term moves are nothing more than random. But if that is the case, how can so many stocks be riding high one minute then cut down the next?

Others believe that macro-economics drive prices and dismiss trend following out of hand. The fact is, however, trend following strategies work and they have been working for some time.

One very basic but popular trend following strategy is based on the 50 day moving average. In this article I look at whether this simple strategy can work in todays markets.

50 Day Moving Average Strategy

To test the 50 day moving average strategy I opened up the Amibroker trading platform and wrote some basic code. In this first test, the system buys a stock when the 50 day moving average crosses over the 200 day moving average. It sells when the 50 day moving average crosses back under.

(This a portfolio system that holds a maximum of 10 stocks at any one time. Risk is divided into 10 equal positions and commissions are set at $12 per trade. This was tested on stocks in the S&P 1500 US stock universe between August 2000 and August 2010. Trades are entered on the next day open.)
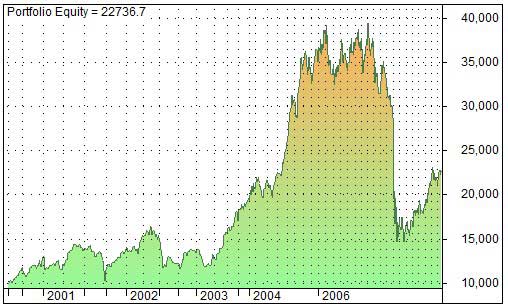
Test 1:

Buy = 50 day MA (close price) crosses over 200 day MA.
Sell = 50 day MA (close price) crosses under 200 day MA.

CAR: 16.94% Max Drawdown: -54%

50 day moving average strategy

As you can see, over stocks in the S&P 1500 between 2000 and 2010, this simple 50 day moving average strategy actually did very well.

Now let’s see how it does when the MA is substituted for an EMA (exponential moving average)

Test 2:

Buy = 50 day EMA crosses over 200 day EMA.
Sell = 50 day EMA crosses under 200 day EMA.

CAR: 3.58% Max Drawdown: -69%

50 day moving average strategy test 2

Surprisingly, the EMA strategy does very poorly compared to the simple MA and delivers a much larger drawdown.

Next, let’s see how the same 2 strategies work on weekly data instead of daily data:

Test 3:

Buy = 50 week MA crosses over 200 week MA.
Sell = 50 week MA crosses under 200 week MA.

CAR: 11.63% Max Drawdown: -67%

Test 4:

Buy = 50 week EMA crosses over 200 week EMA.
Sell = 50 week EMA crosses under 200 week EMA.

CAR: 8.50% Max Drawdown: -63%

From these very rough and simple tests we can say that Test 1 looks the most promising. It produces the highest annual return (CAR) and the smallest drawdown.

Test 5 (out of sample):

Now it is important to see how the test does on out of sample data, to see whether this 50 day moving average strategy could actually work going foward. I therefore moved the test forward and ran the system between 1/1/2010 to 1/1/2014. The results are as shown below:

CAR: 11.42% Max Drawdown: -26%

50 day moving average strategy test 3

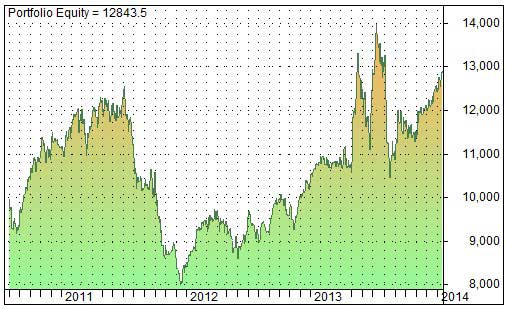
These out of sample results look promising. The annual return is high and drawdown low. They are not as good as the insample (Test 1) and that is expected.

Test 6:

For this final test I wanted to see whether buying a stock when it moves above its 50 day moving average could be a worthwhile strategy. This is a strategy I’ve read about in the past. It buys when the open price moves above the 50 week MA and sells when the open price moves below the 50 week MA.

Buy = Open price crosses over 50 week MA
Sell = Open price crosses under 50 week MA

50 day moving average strategy test 6

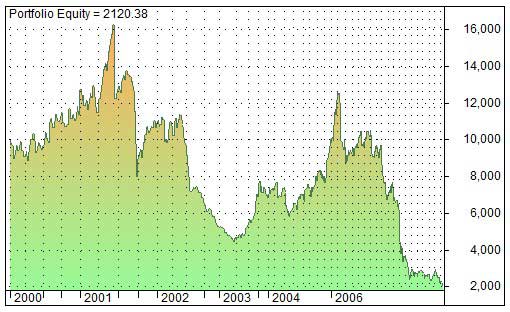
As you can see from the chart, this system doesn’t work well at all. It enters a lot of trades and suffers from too many whipsaws. This strategy did just as poorly when using EMA instead of MA and on daily data instead of weekly data.

Conclusion

It is impossible to say from these tests whether any of this strategies will work in the future, (though we can pretty much eliminate test 6 since it produces too many trades to be profitable). More testing needs to be done to verify these tests on different data sets and it is important to also include delisted stocks.

However, the simple 50 day moving average strategy shows enough promise here for further analysis. The adding of rules and filters may be able to turn this into a worthwhile trend following strategy.


Thank You For Reading

joe marwood profile pictureJoe Marwood is an independent trader and the founder of Decoding Markets. He worked as a professional futures trader and has a passion for investing and building mechanical trading strategies. If you are interested in more quantitative trading strategies, investing ideas and tutorials make sure to check out our program Marwood Research.


Disclaimer

This post expresses the opinions of the writer and is for information, entertainment purposes only. Joe Marwood is not a registered financial advisor or certified analyst. The reader agrees to assume all risk resulting from the application of any of the information provided. Past performance is not a reliable indicator of future returns and financial trading is full of risk. Margin trading can lead to losses more than in your account. Mistakes in backtesting and presenting of analysis regularly occur. Please read the Full disclaimer.

Filed Under: Stocks, Strategies/ Systems, Trend Following Tagged With: moving average, stocks, trading, trading systems, Trend Following, trends

Recommended Educational Resources:


  • Discover New Trading Strategies
  • Learn Japanese Candlesticks (Free)
  • Mental Models For Trading (Free)
  • Indicators For Amibroker (Free)
  • Tools For Options Traders (Free)
  • Historical Data For 8000 Stocks (Free)

Reader Interactions

Trackbacks

  1. Evidence for why forex trading is not easy says:
    June 4, 2014 at 5:14 pm

    […] no test was able to deliver more than 6% in annual returns. (This is somewhat in contrast to strategies on stocks which appear to perform much […]

    Reply

Leave a Reply Cancel reply

Your email address will not be published.

Primary Sidebar

Access Marwood Research image

Popular

low priced stocks analysis

Should You Buy Low Priced Stocks?

trade example in the us ten year

Shorting The US Ten Year With ATR – A Simple System That Shows A Profitable Edge

The Truth About Intraday Momentum

The more frequently you can trade your edge, the faster you can play out your expectancy and the quicker you can recover from any drawdown.

The Downsides Of Trading Systems

Stock screen image

20 Traps All Traders And Investors Must Avoid

Which Trailing Stop Is The Best?

The System Traders Feedback Loop – Don’t Get Stuck In The Back-Testing Spiral

RSI trade divergence example

Testing 3 Simple Divergence Trading Strategies

Search

Recommended Resources

  • Discover New Trading Strategies
  • Learn Japanese Candlesticks (Free)
  • Mental Models For Trading (Free)
  • Indicators For Amibroker (Free)
  • Tools For Options Traders (Free)
  • Hist. Data For 8000 Stocks (Free)

Financial Disclaimer

Financial trading is risky and you can lose money. Joe Marwood is not a registered investment advisor and nothing on this site is to be regarded as personalized investment advice. Past performance is not indicative of future results. Data errors and mistakes do occur. Please see the full disclaimer.

Footer

About The Author

Joe Marwood is an independent trader and investor specialising in financial market analysis and trading systems. He worked as a professional futures trader for a trading firm in London and has a passion for building mechanical trading strategies. He has been in the market since 2008 and working with Amibroker since 2011.

Joe Marwood Profile PIc

Recent Posts

  • Investing With Intelligent Machines
  • Trend Following With ETFs and Large Cap Stocks
  • Should You Trade This Earnings Pullback Strategy?
  • Simple Algo Trading With Alpaca And Streak
  • Is Value Investing Dead? Dissecting The Value Investing Narrative
  • How To Screen For Stocks With Norgate Data
  • Do Stocks Have A Floor?
  • What Trading Signals Work Best For Long-Term Investors?

Search

Privacy policy | Contact | Disclaimer | All Rights reserved. JB Marwood.